OMA User Manual
To perform an OMA analysis on a structural model, you must log in to the console with a user account with permissions to use the OMA module.
At least one network must be defined, to which the structural model to be analyzed will be associated; the user who will be used to execute the OMA must be associated with this network.
1. Access the main window of the OMA module
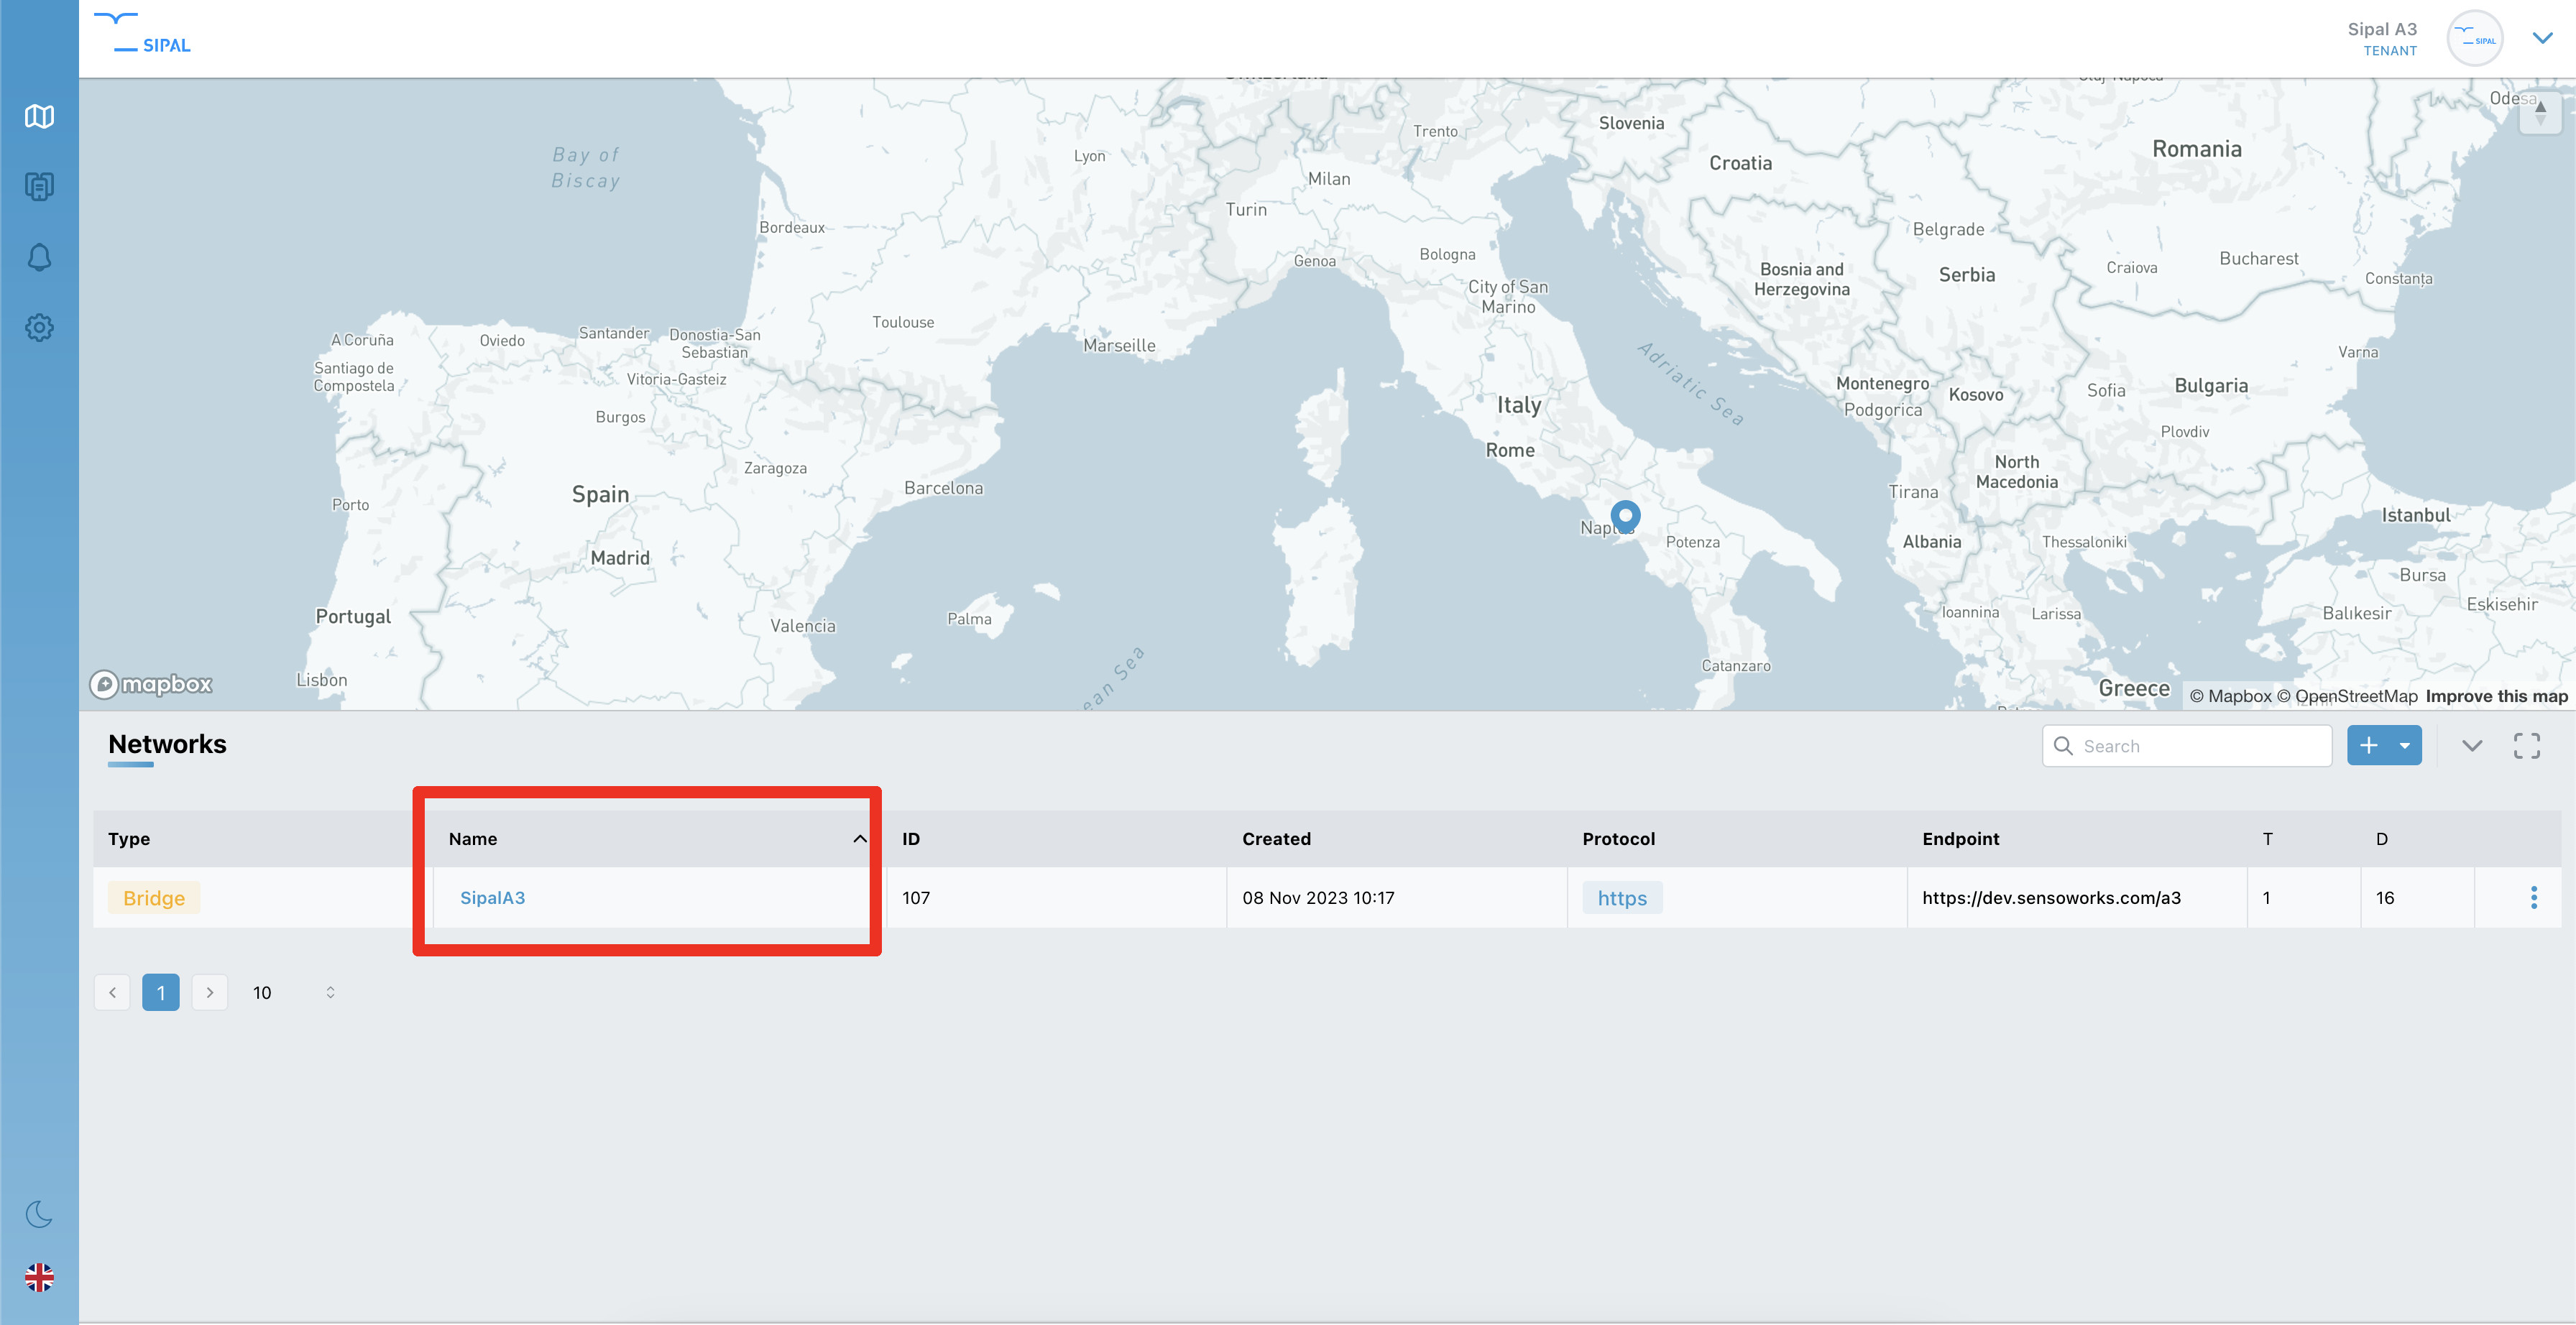
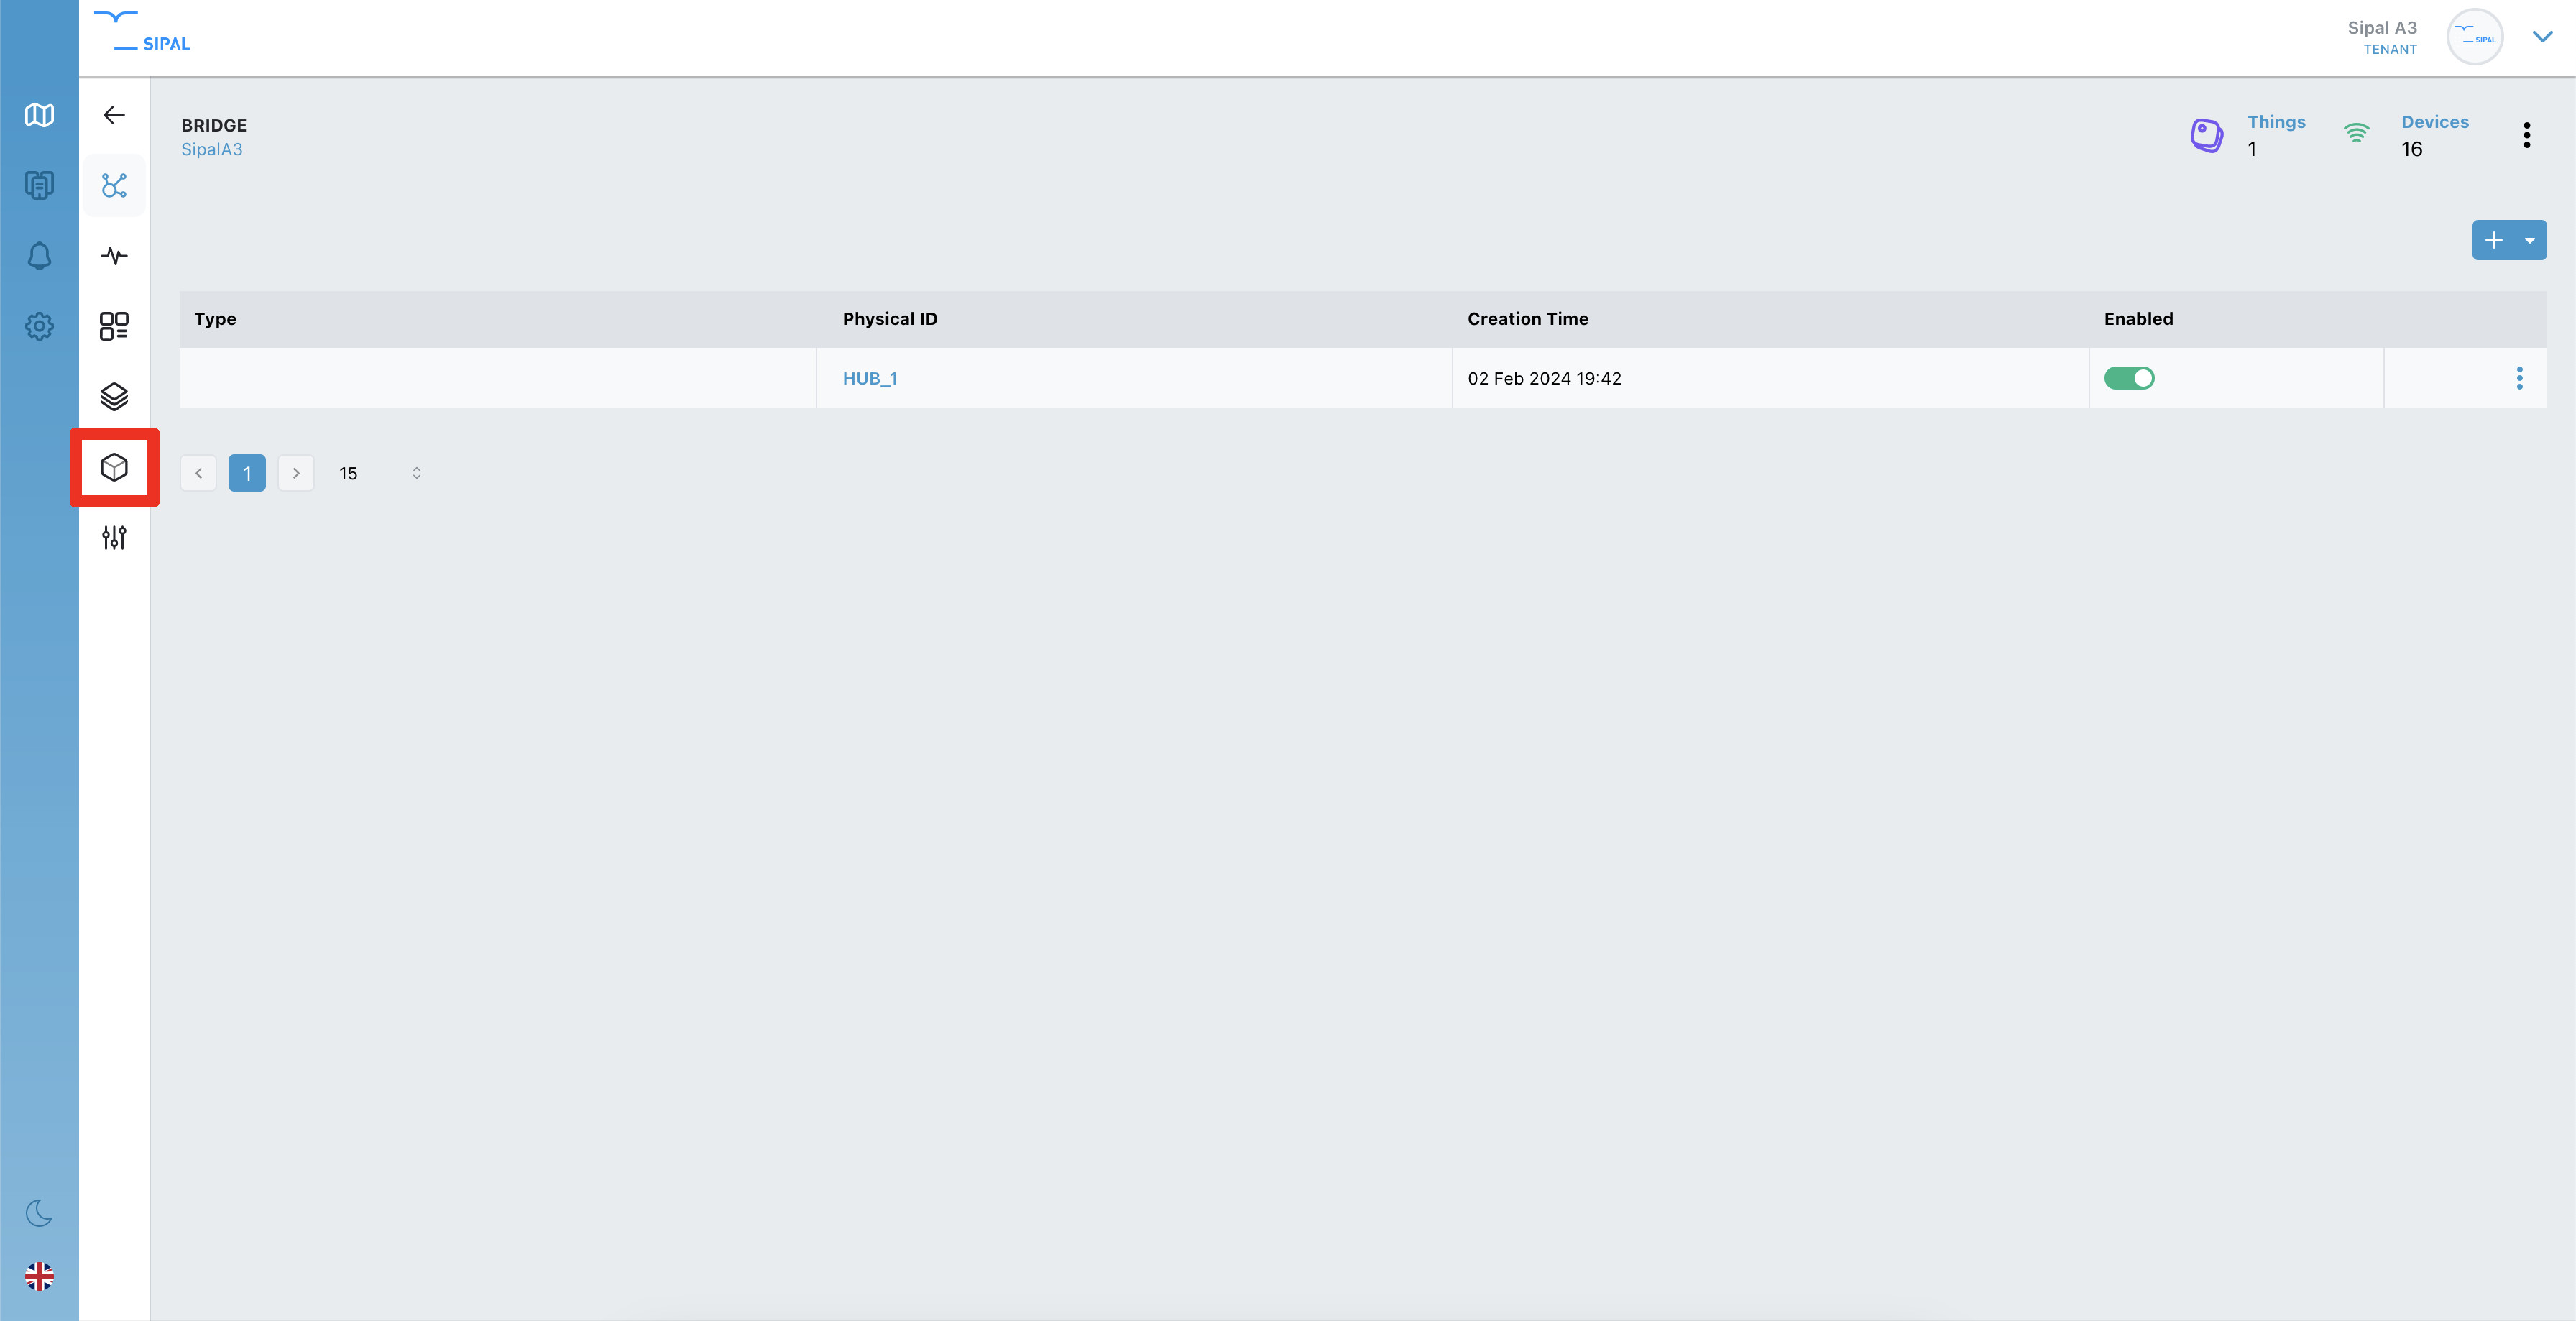
Once inside a network, to use the OMA module, click the button highlighted on the left of the screen.
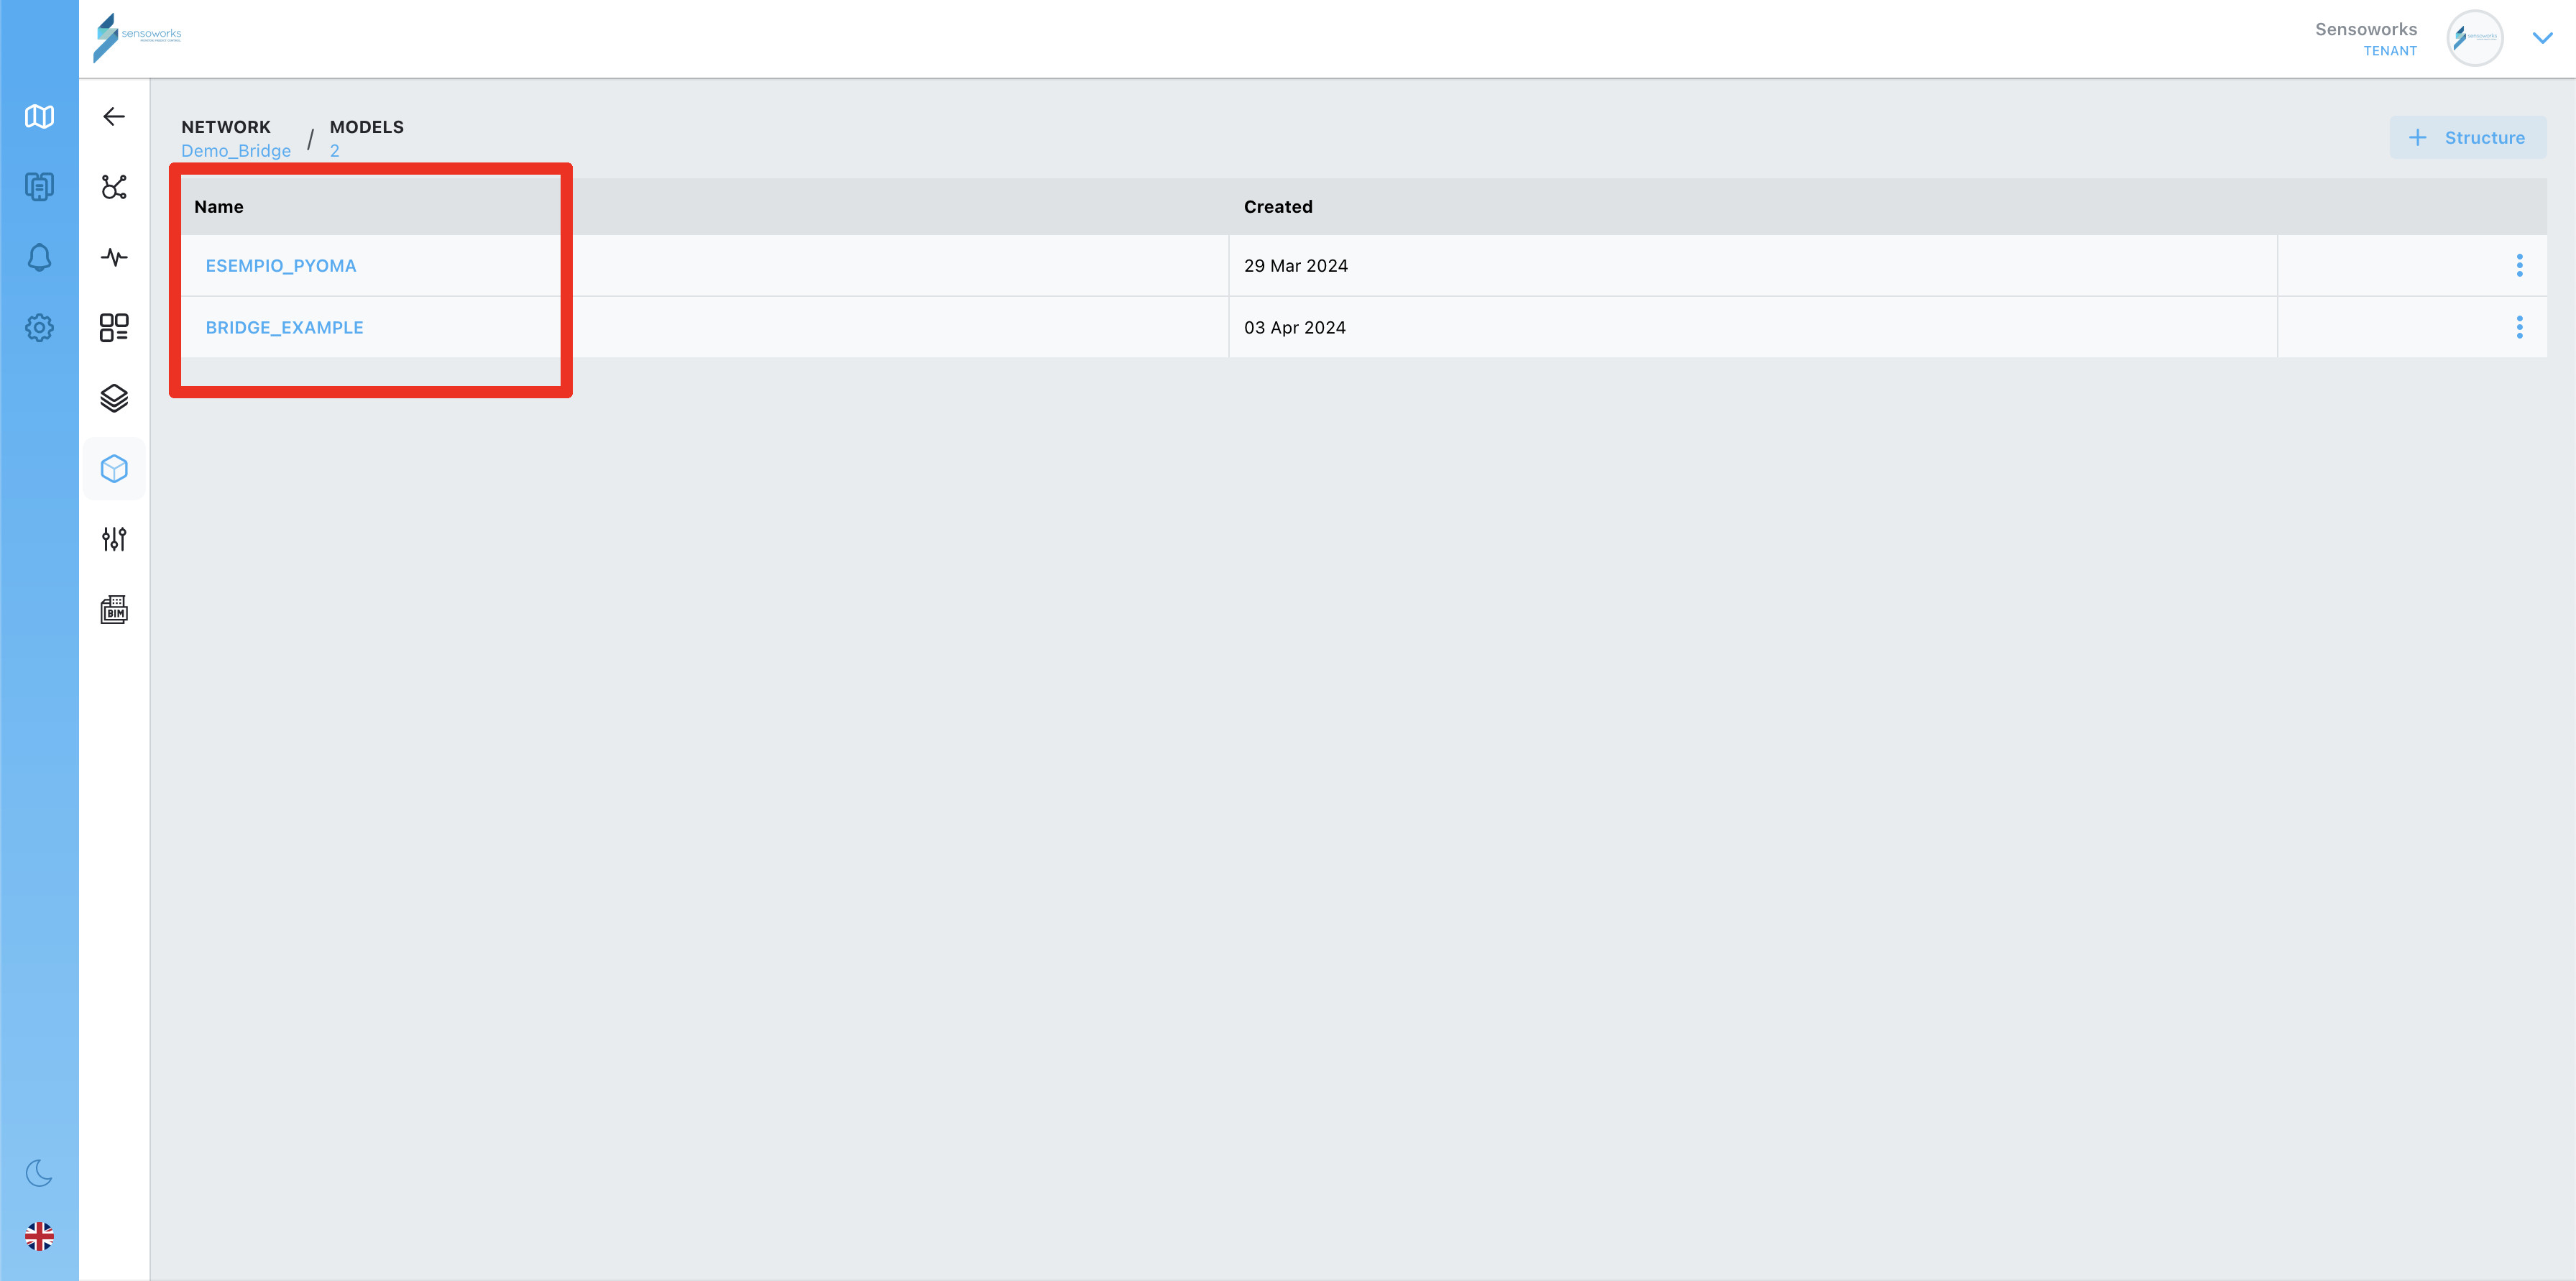
The console will display the main window of the OMA module, which lists the structural models already defined. A new one can be created from the top-right ”+ Structure” button. See section 2 of this guide to know how to create a new structure.
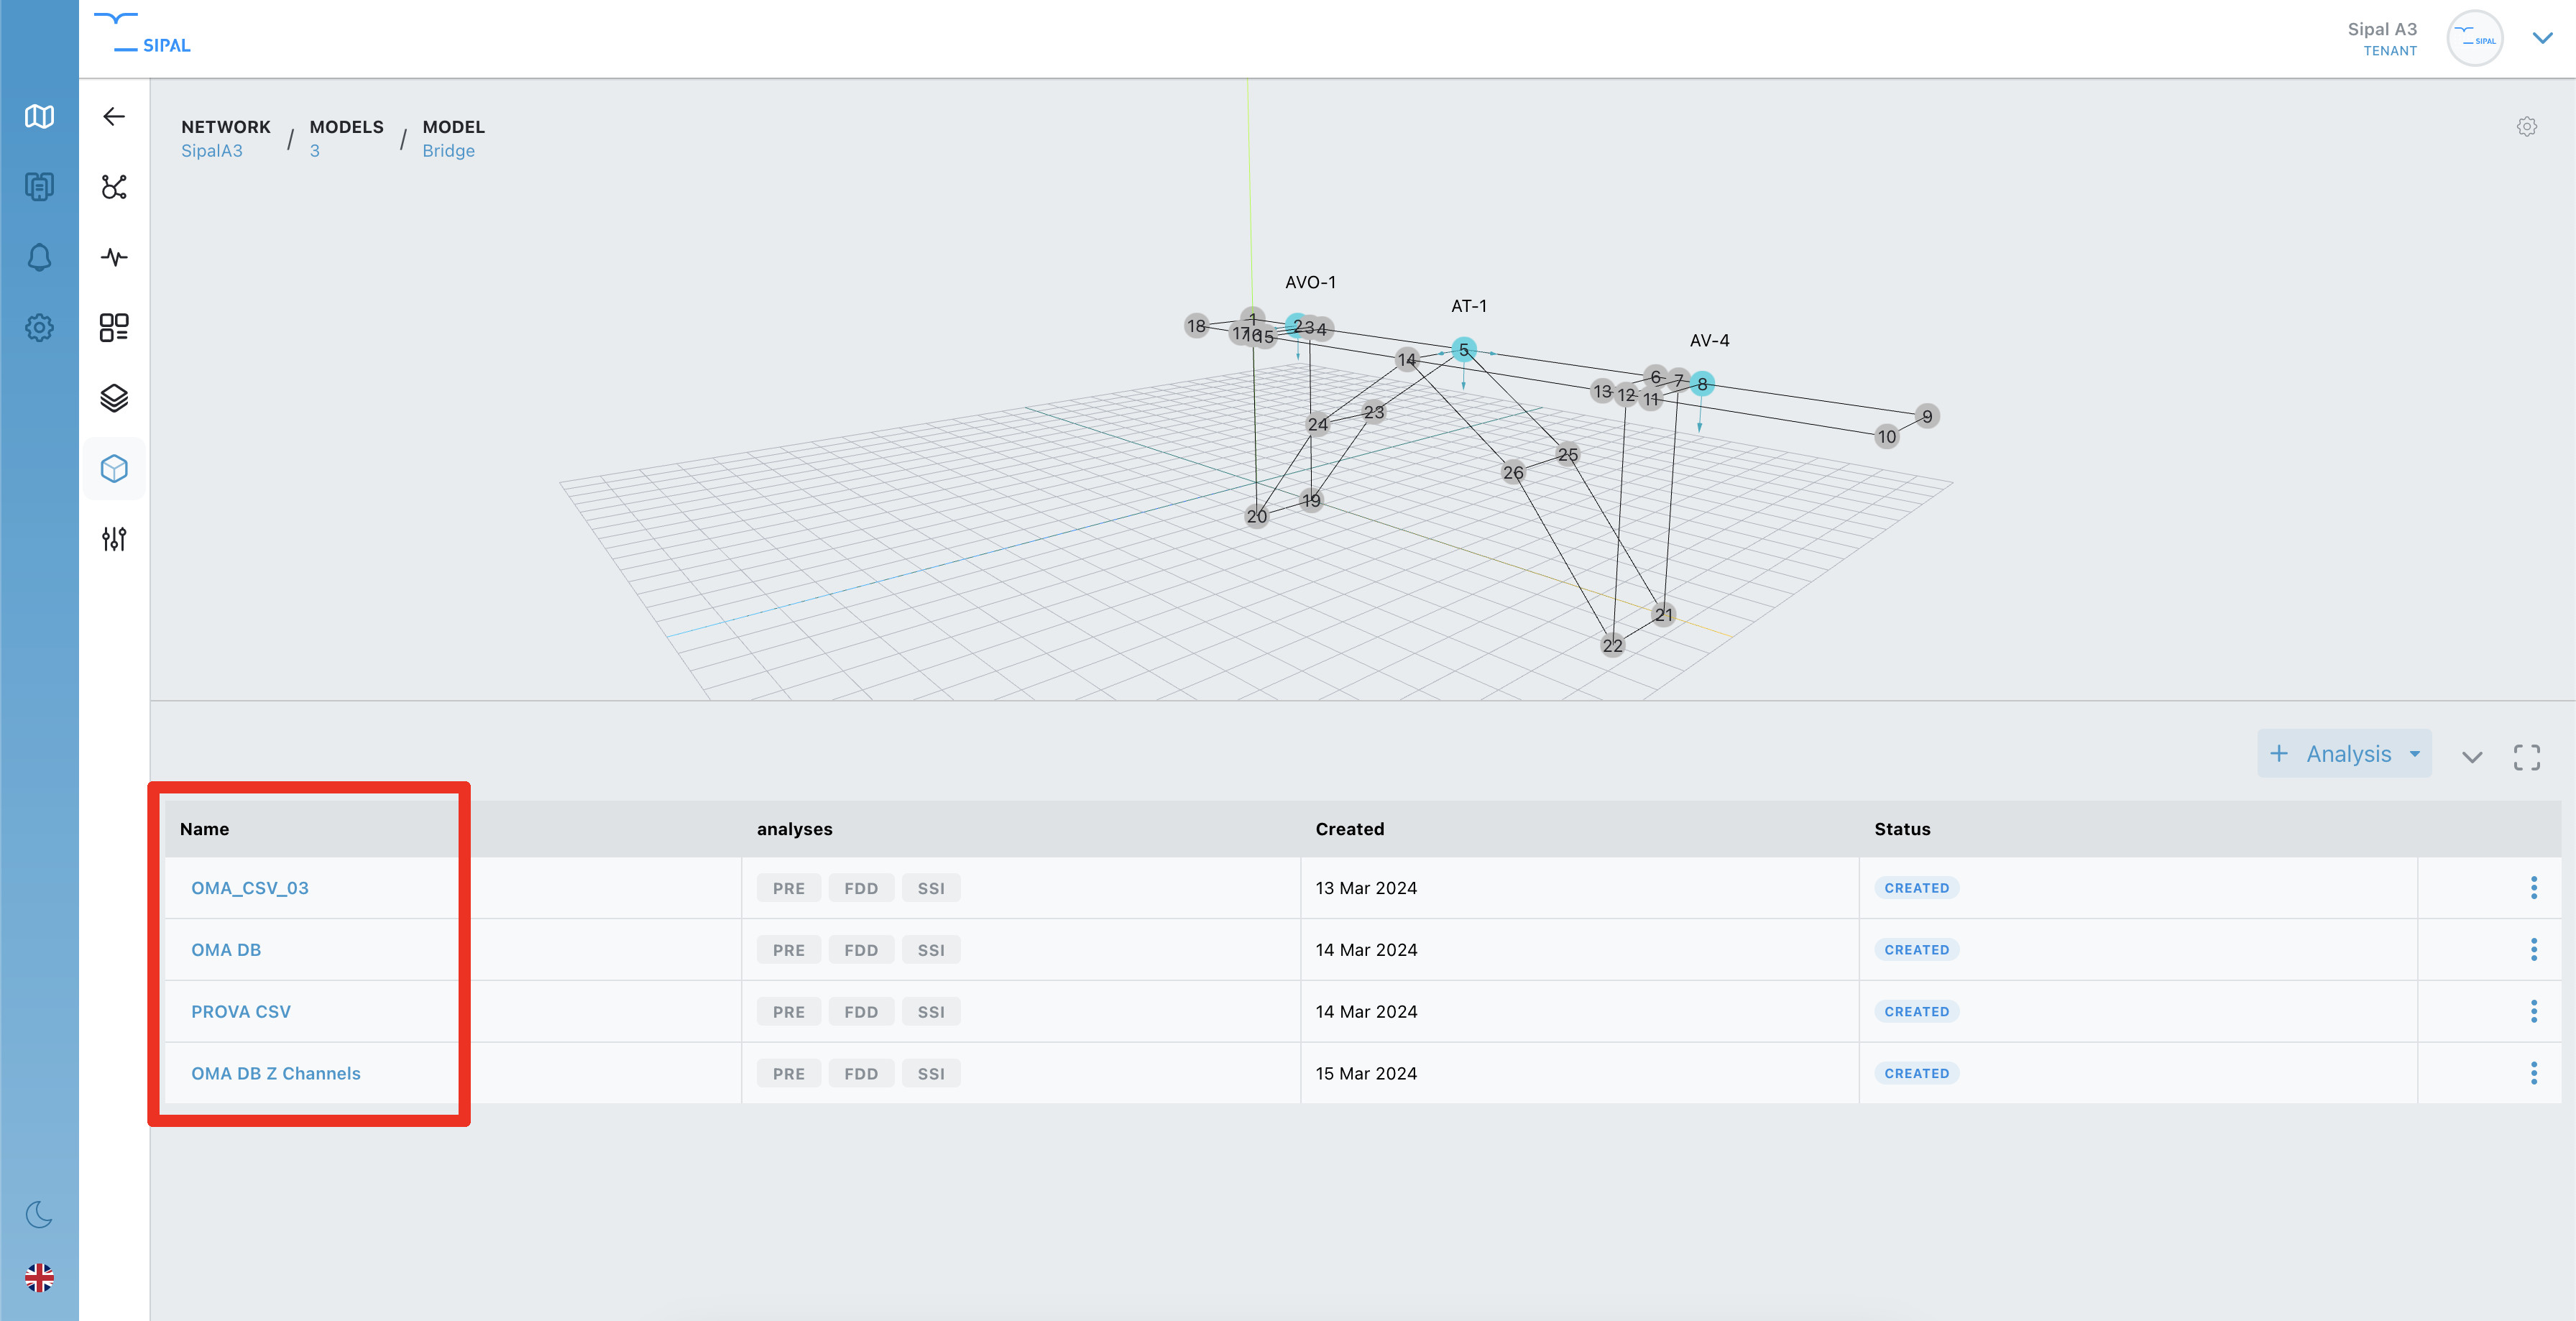
Inside a structure, you can find listed all the analyses. You can choose an analysis from the ones already presents or a new one can be created from the top-right ”+ Analysis” button. See section 3 of this guide to know how to create a new analysis.
2. Creation of a structure
Once you click on the top-right ”+ Structure” button, the following modal will open (see image).
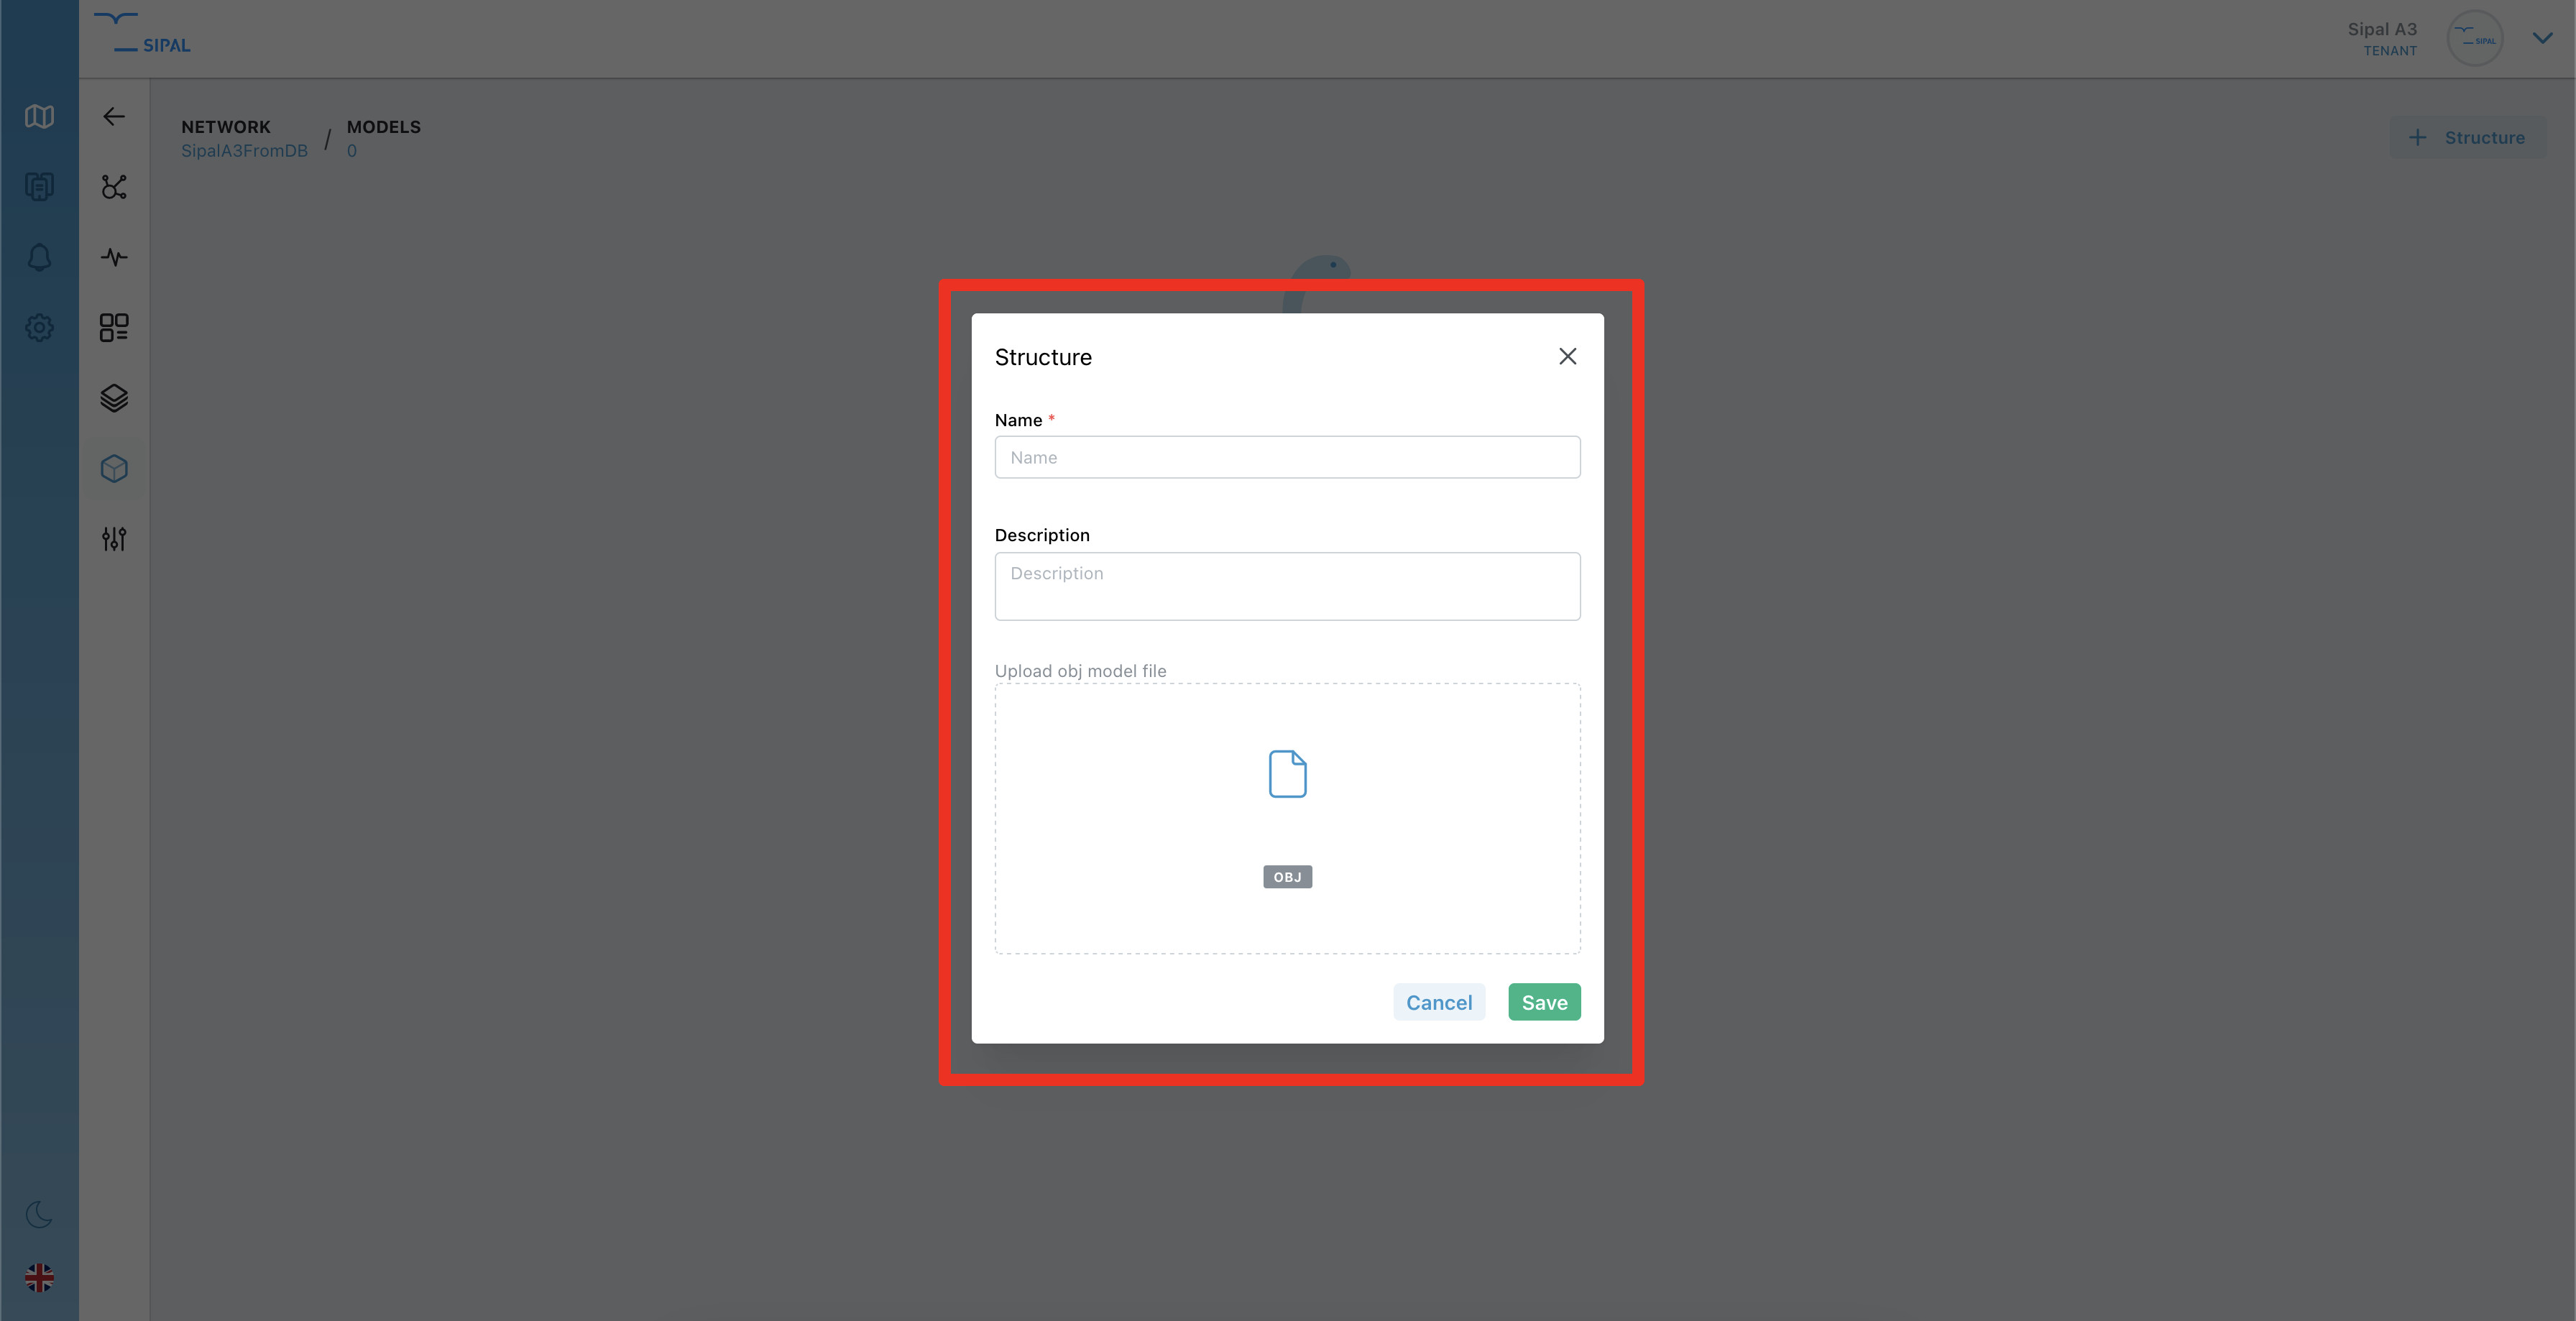
An unique name is mandatory and the description is optional. A 3D model of the structure in the OBJ format must also be uploaded.
After having uploaded the 3D model, if the data for the OMA analyses is taken from the DB, the vertexes must be linked to the correct devices (accelerometers). This means the device installed in the vertex 1 position must be mapped to the 3D model vertex. To map the devides with the vertexes, you need to click on the top-right gear icon. After doing this, you can then click on the vertex of the 3D model you want to link and compile the modal with the informations.
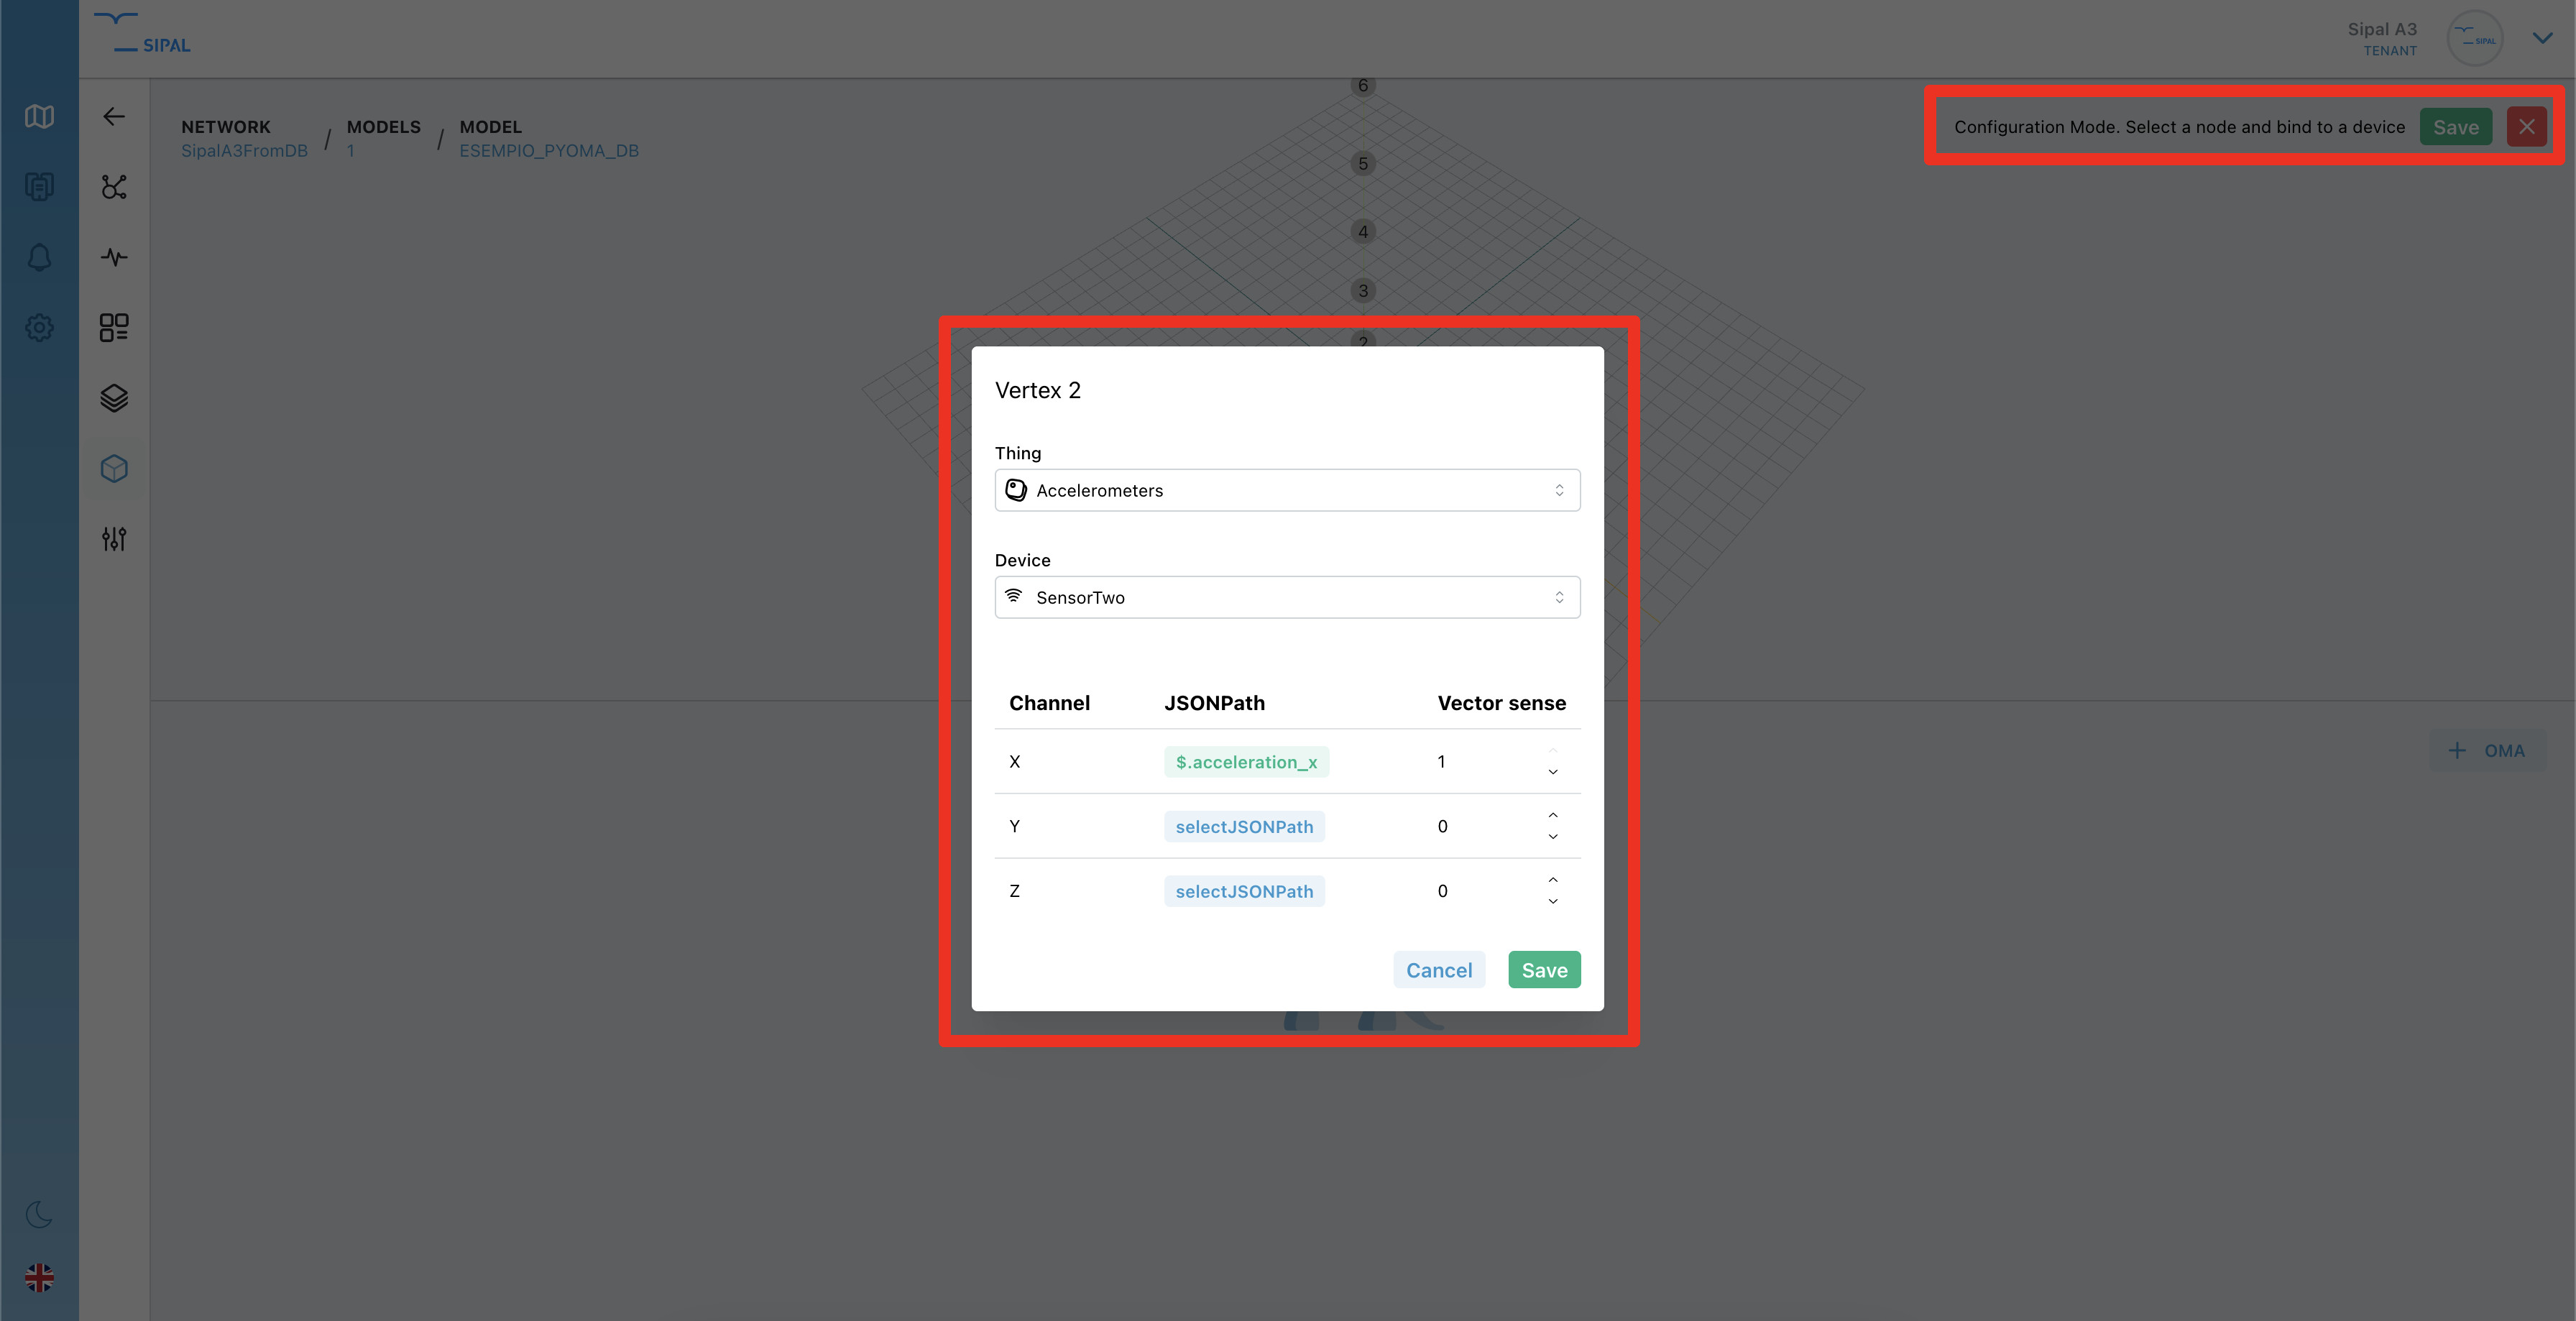
The above step is optional is the data for the OMAs comes from CSV files instead of the DB.
3. Creation of an analysis
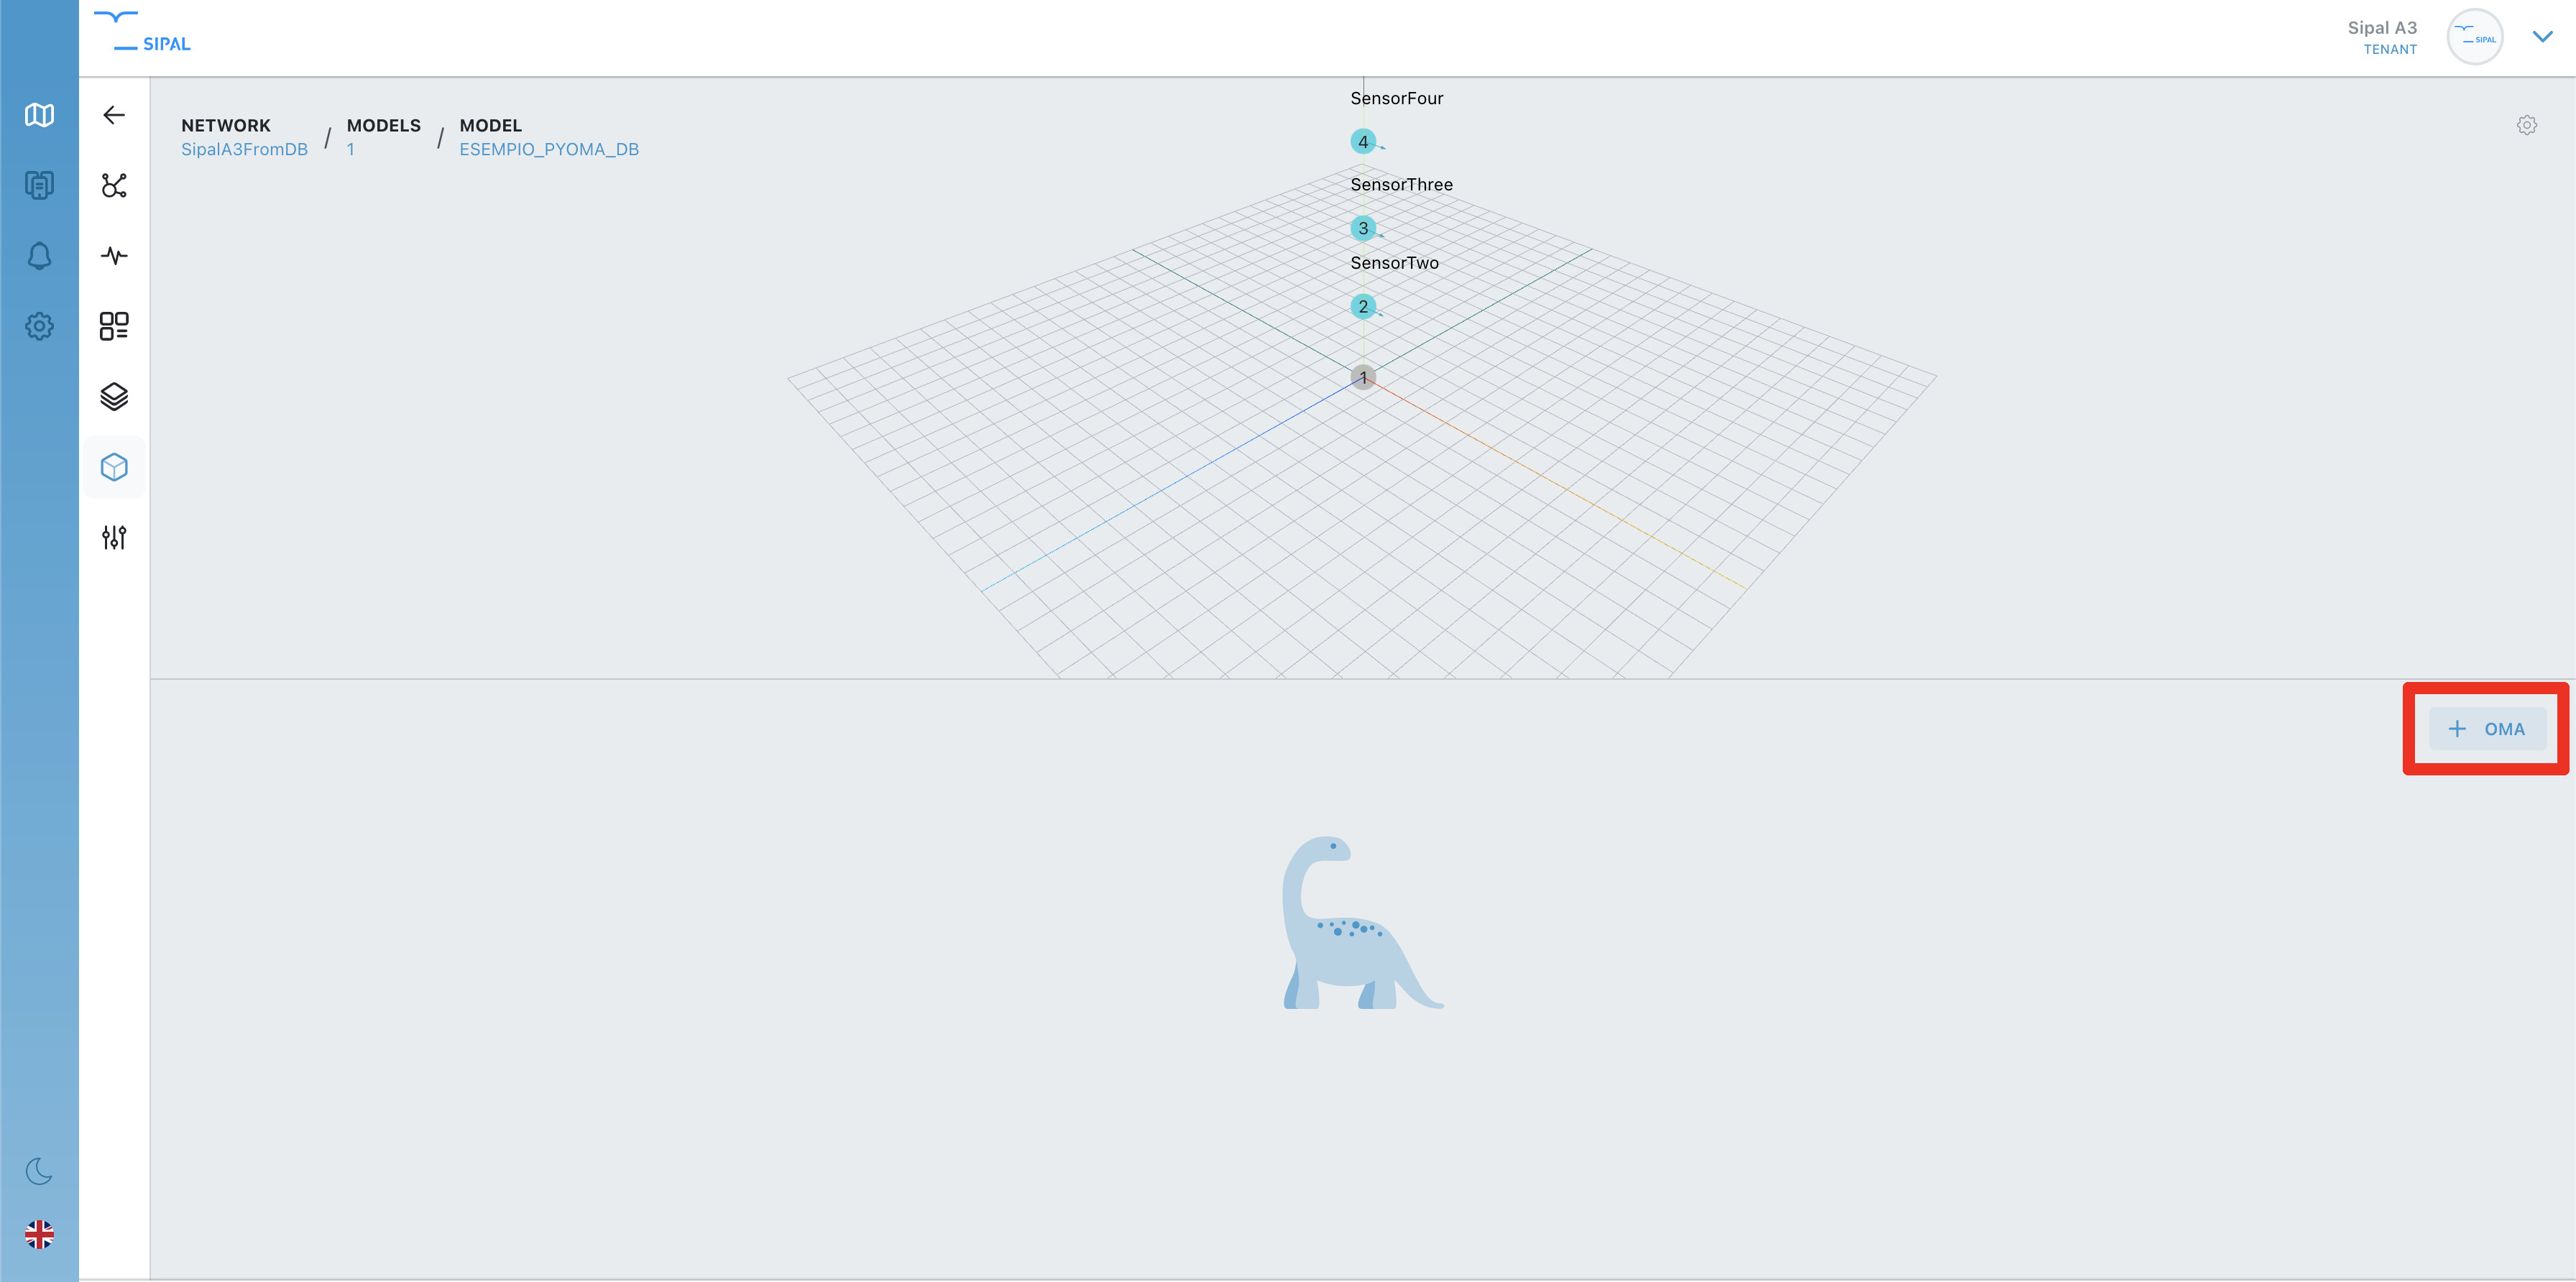
Inside a structure, to create an analysis, from the analysis list page, click on the top-right ”+ OMA” button. A modal will open to add the title and a description (optional).
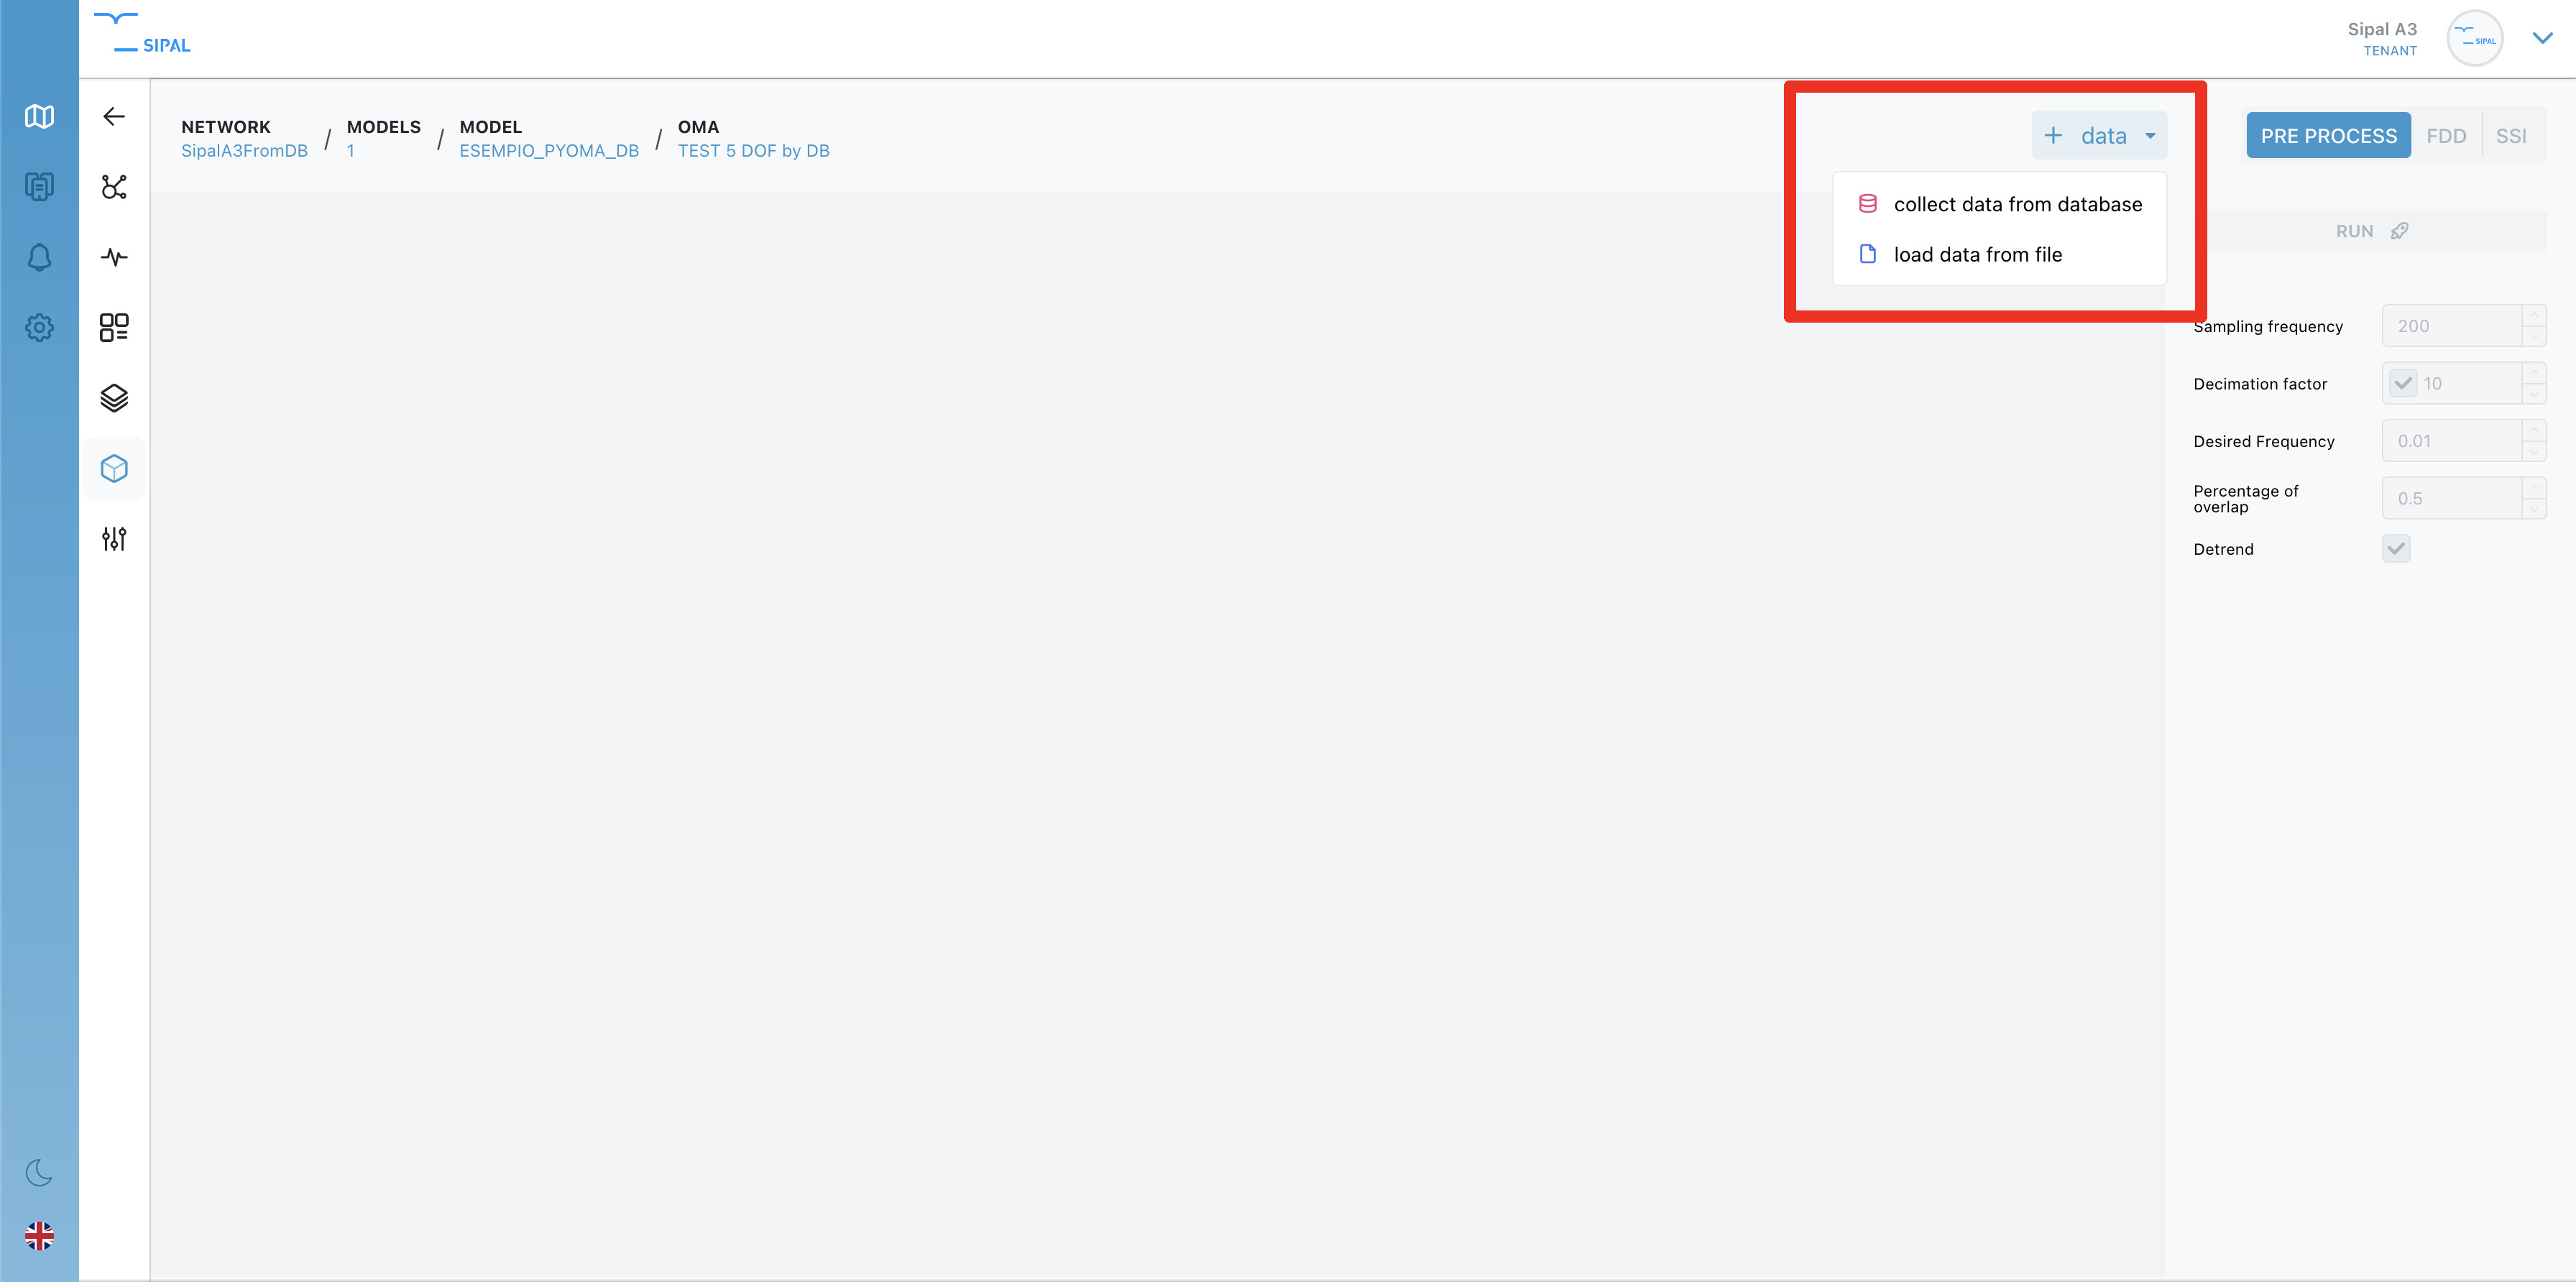
Once created, you can enter it. The first step to make is choosing the source of the accelerometers data for calculating the OMA. Keep in mind you can get the data on the database only if you have done the linking of the model vertexes to the correct devices (accelerometers). Otherwise only CSV input data will be available.
3.1 MongoDb as a data source
If you choose the database as a source, the following modal will open (see image) and you can select a range where data is present for calculating the OMA.
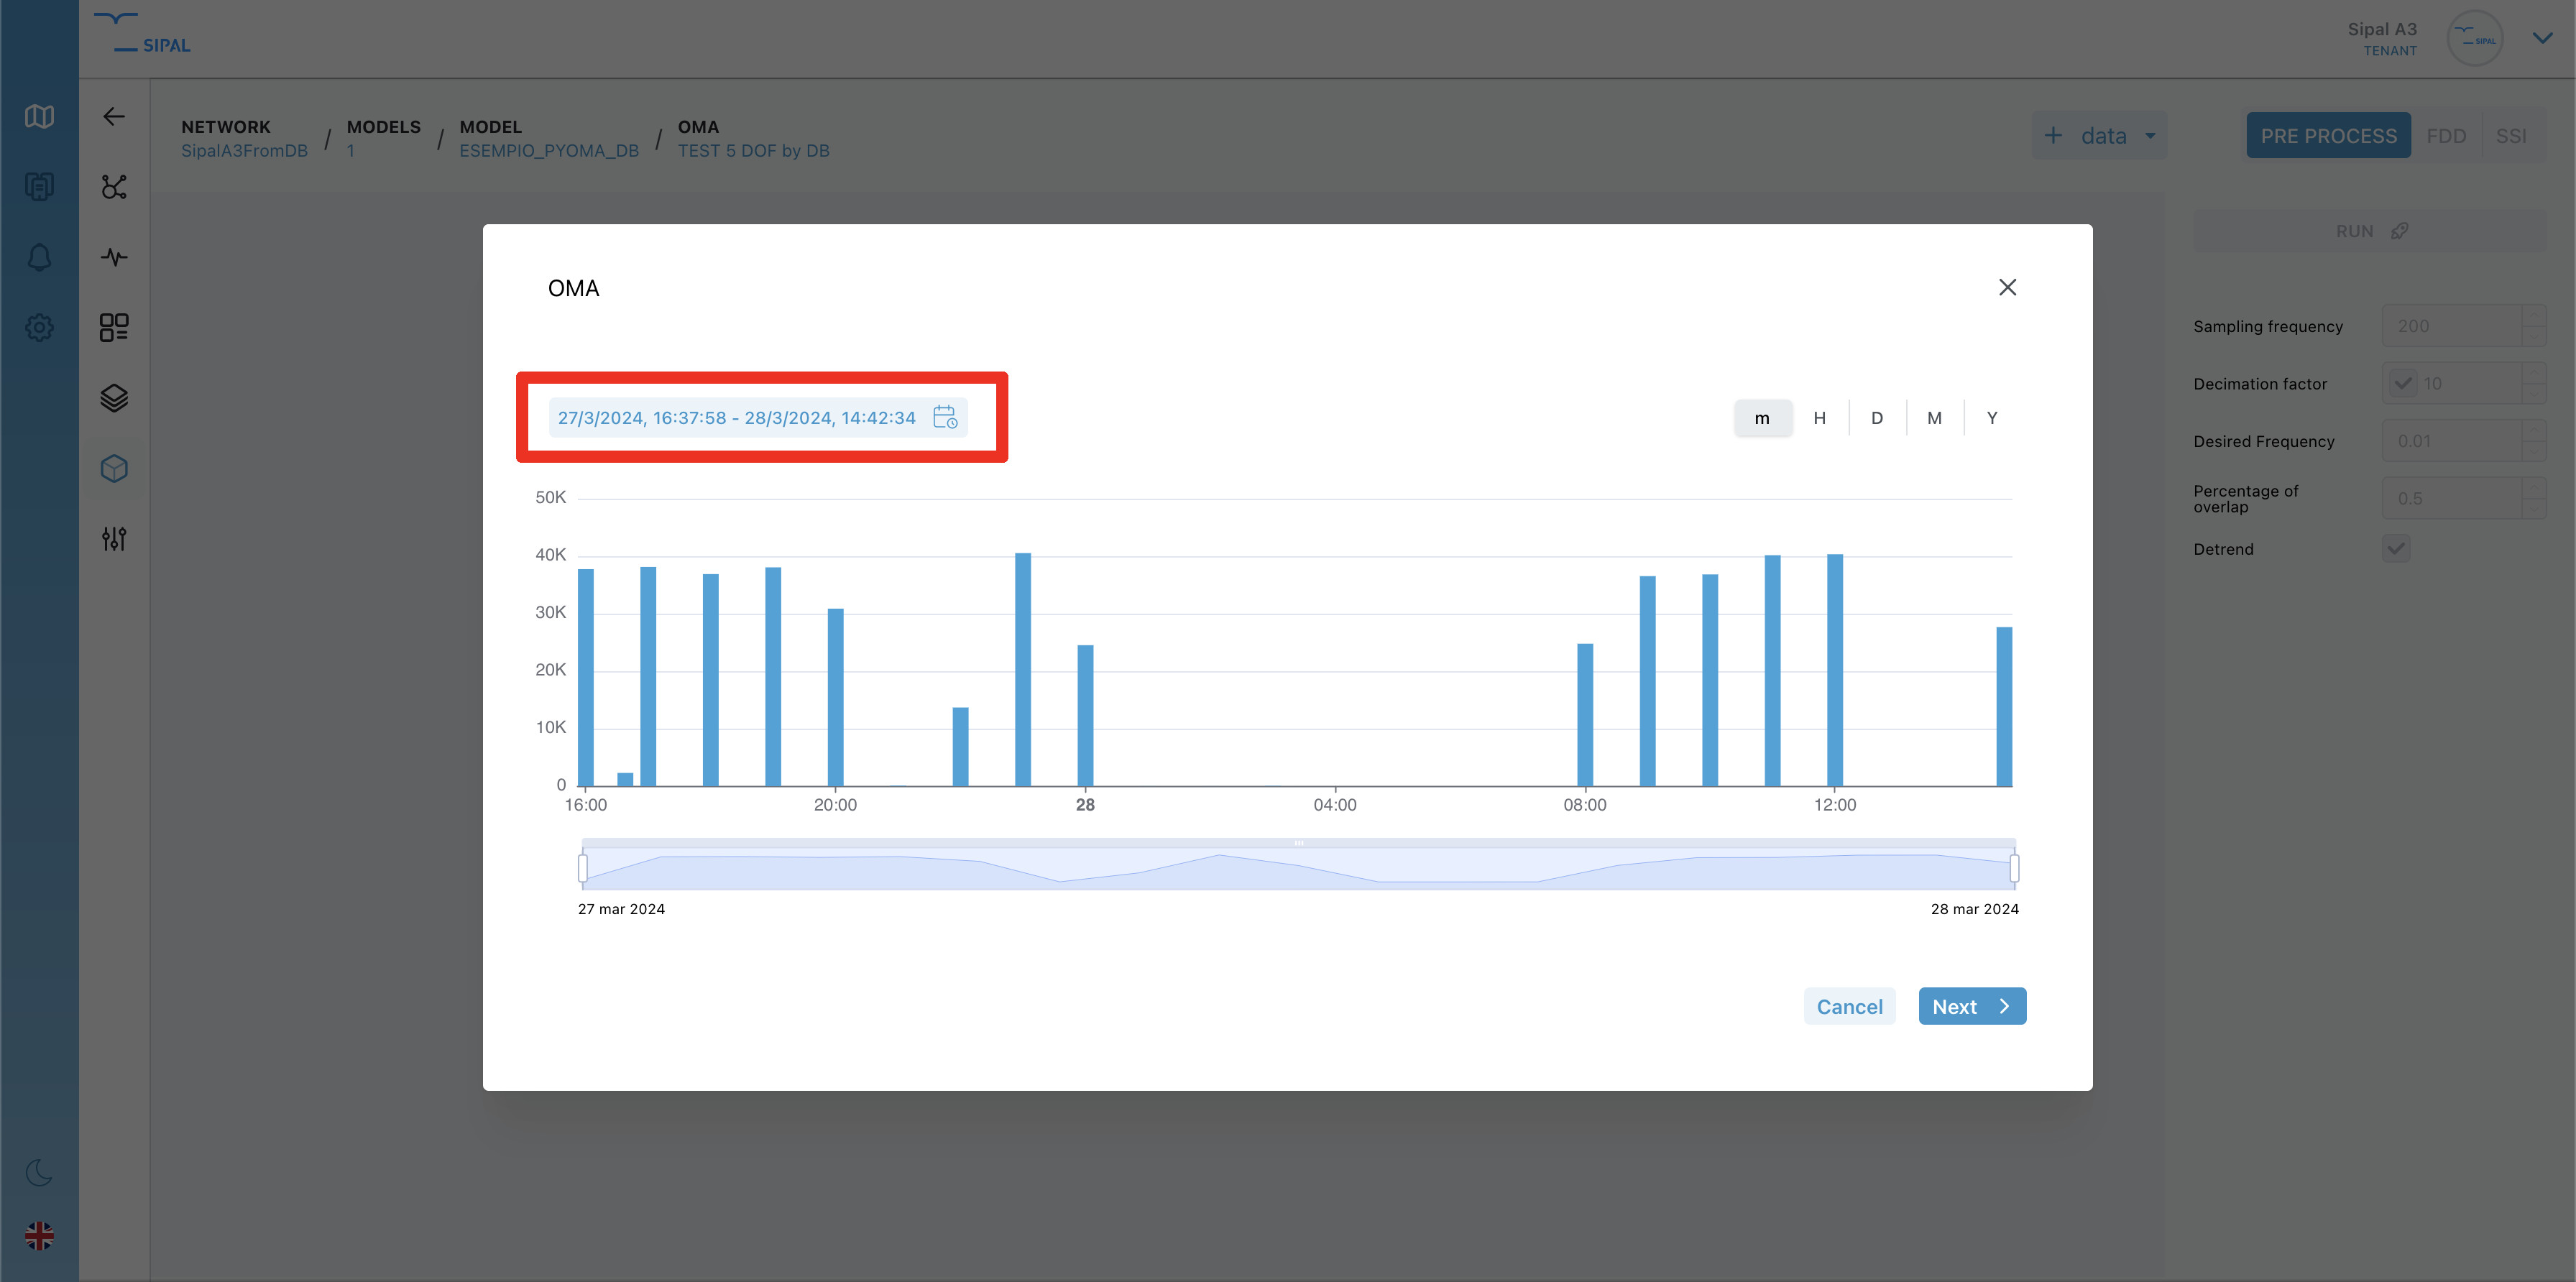
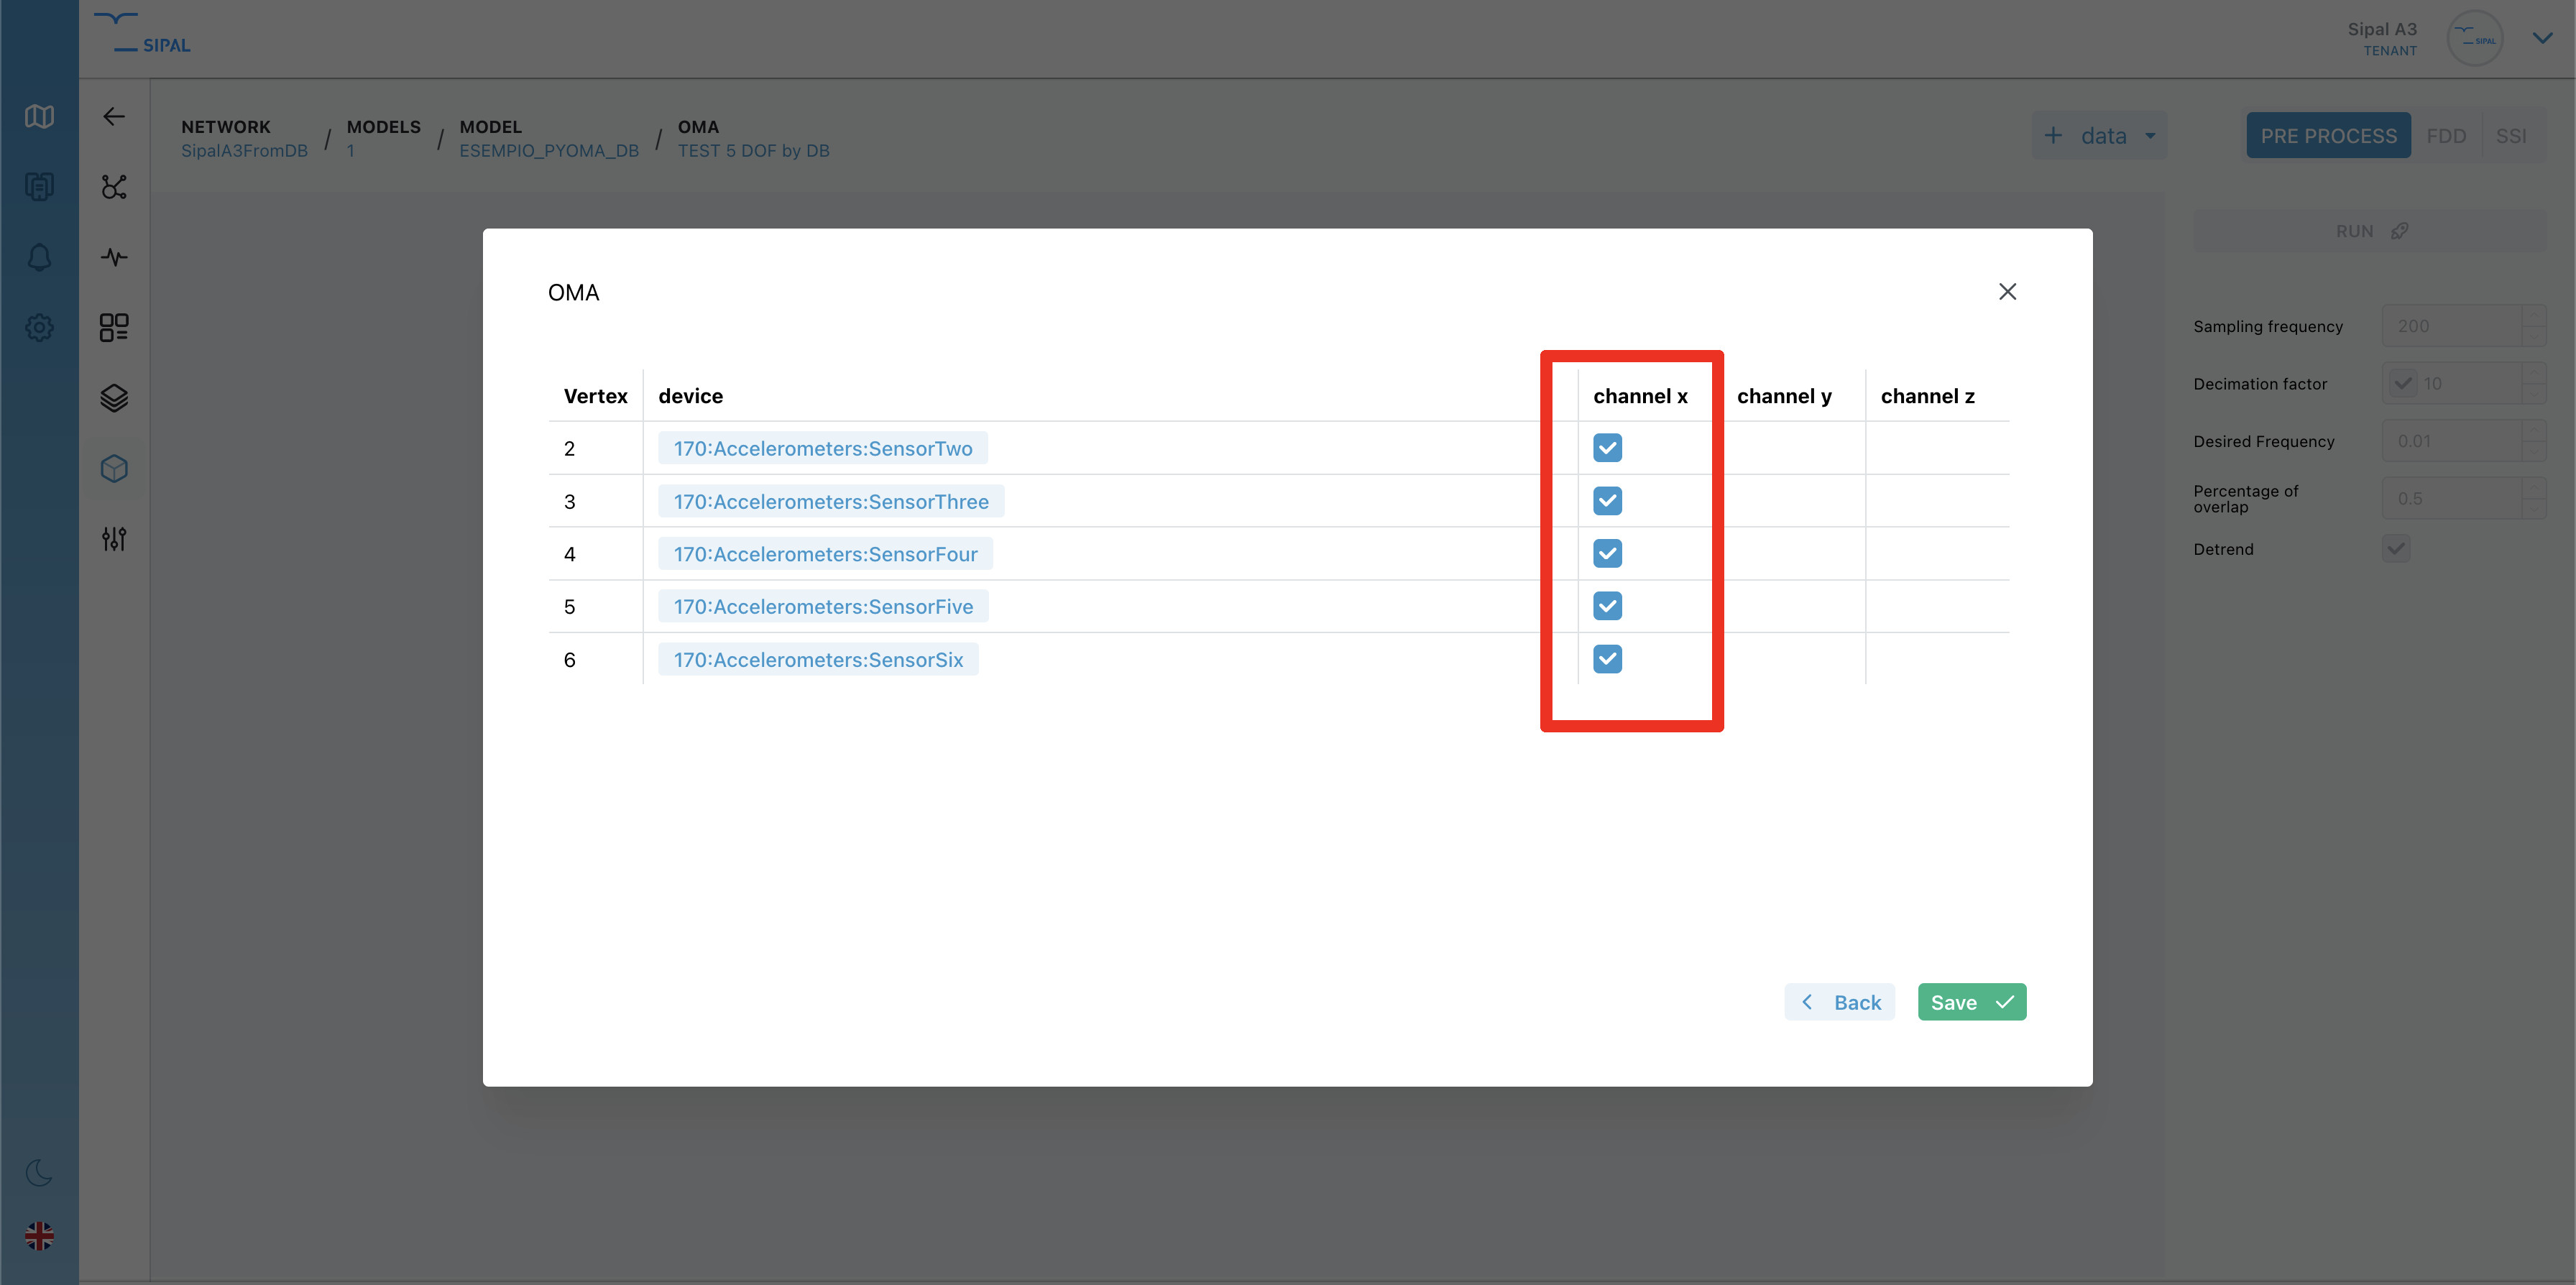
After selecting a range, you can choose which devices are needed for the OMA analysis.
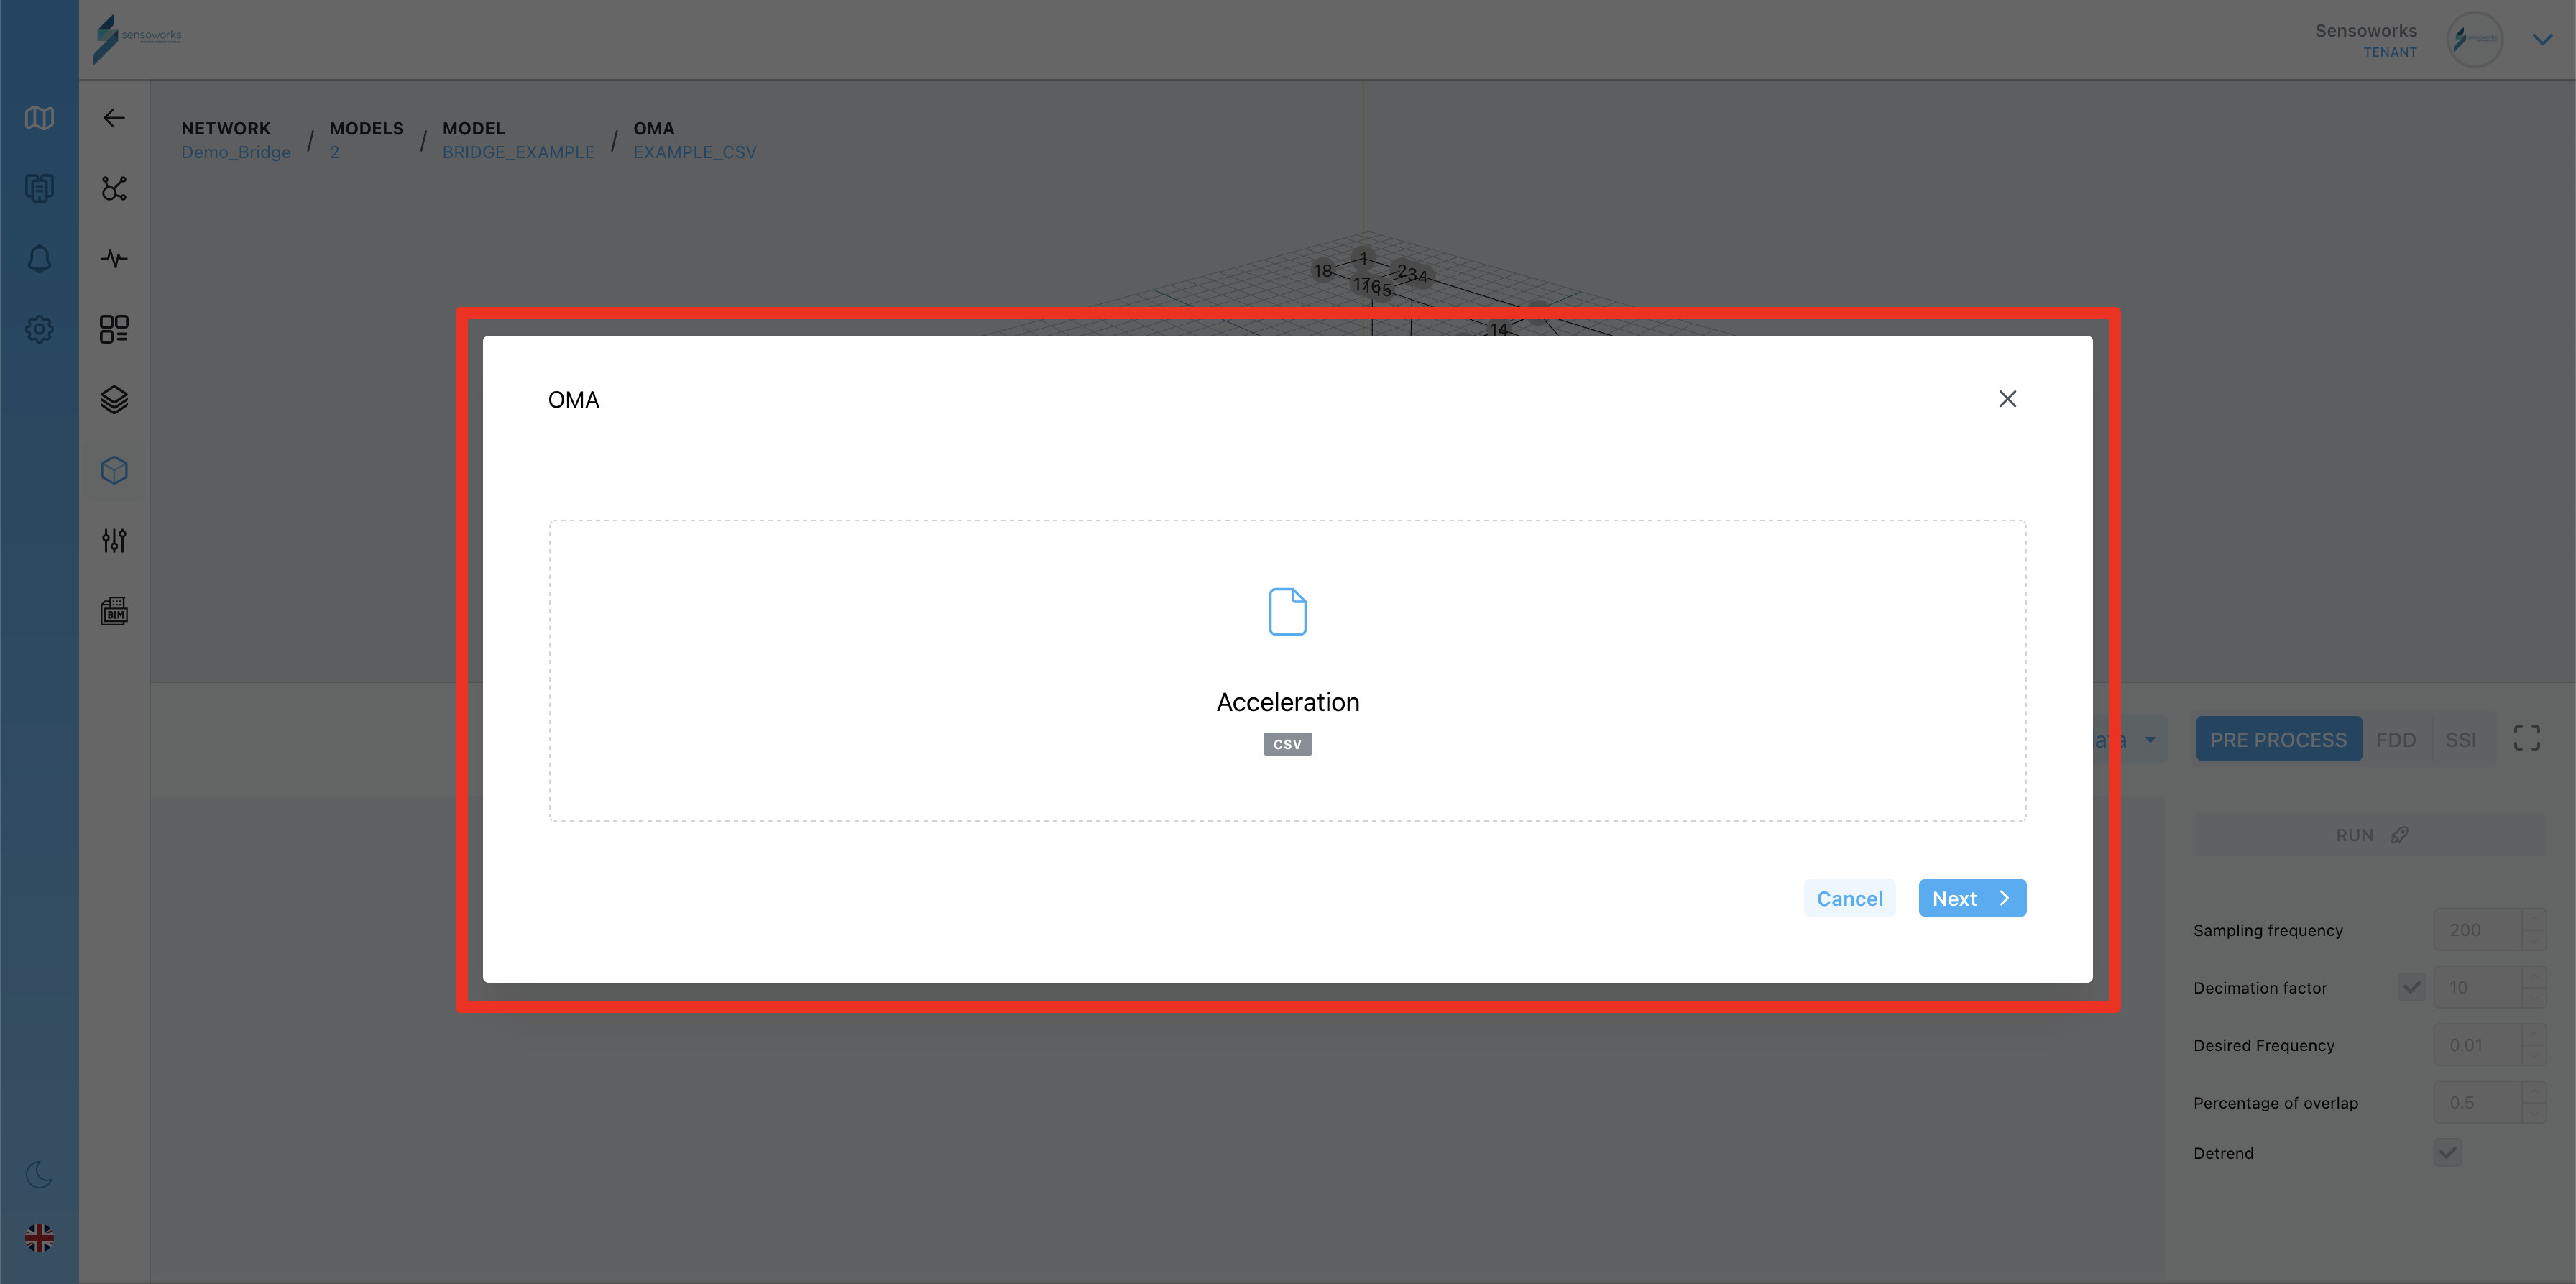
3.2 CSV as a data source
If you choose the CSV as a source, the following modal will open (see image) and you can upload a CSV file with the data for calculating the OMA.
In the next view, you can set how the data is saved inside the CSV file.
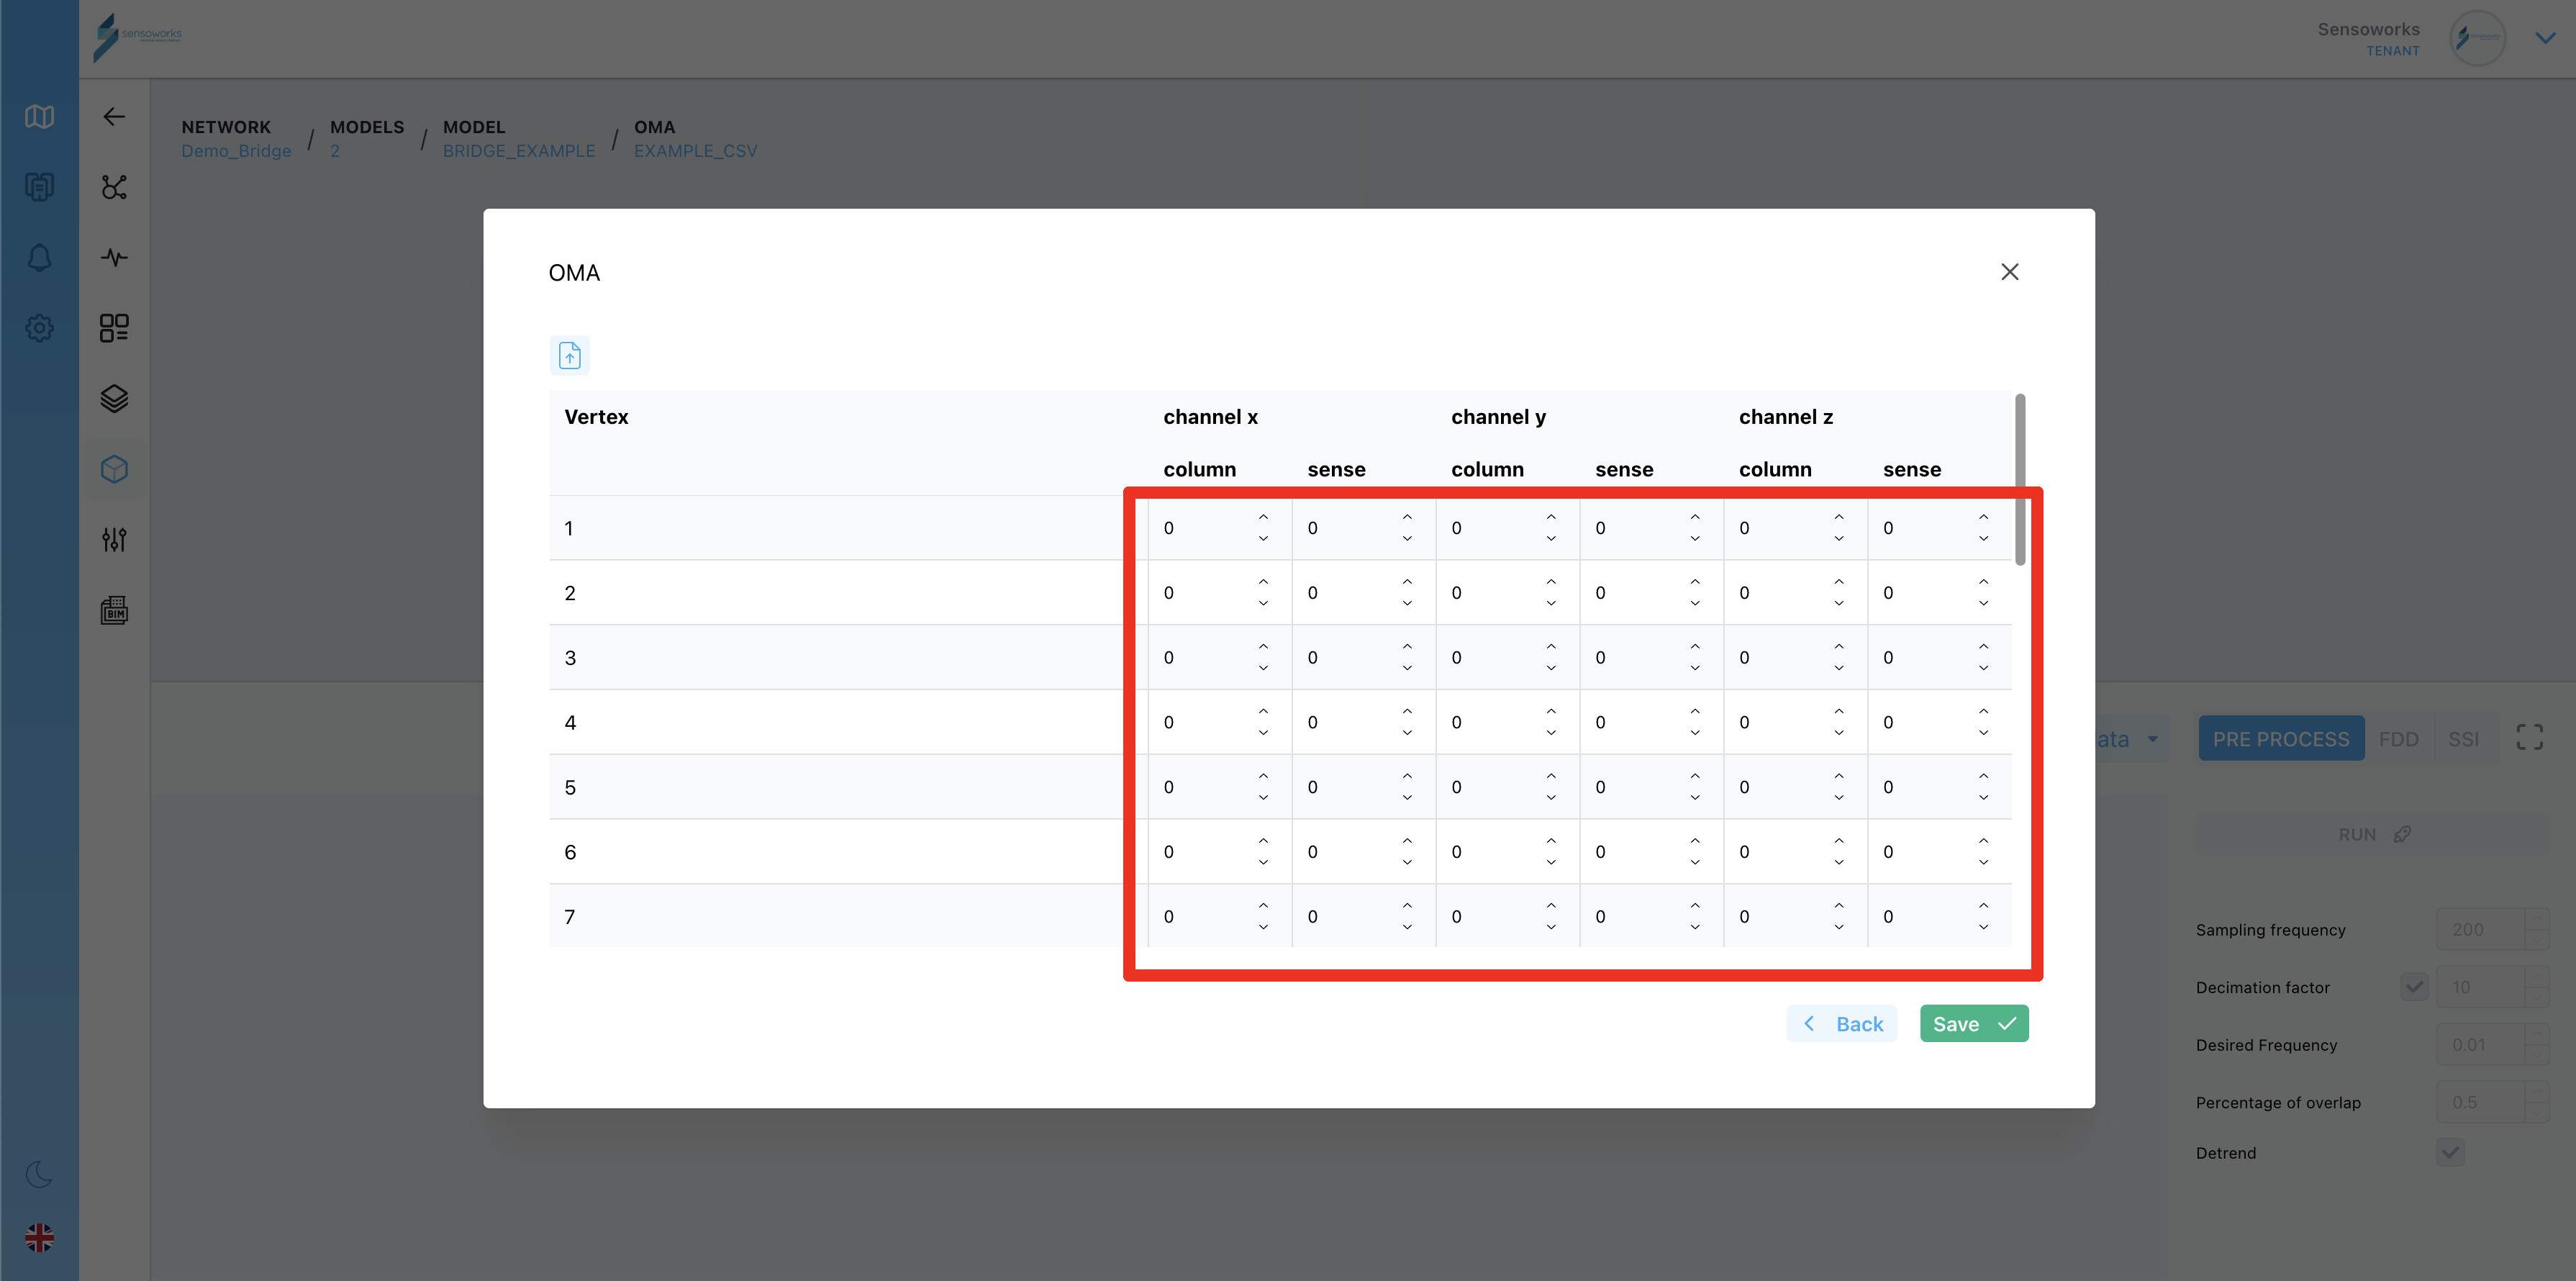
For every channel (X, Y and/or Z) you can set in which column of the CSV file is the relative data and the verse/direction of the sensor. For example, if the data for the vertex one is in the first column and the sense is in the same axis direction, you will set 1 and 1 on the column and sense respectively.
In case you want to compile the table quickly without doing by hand, you can upload a CSV template for the column values with the top-left button.
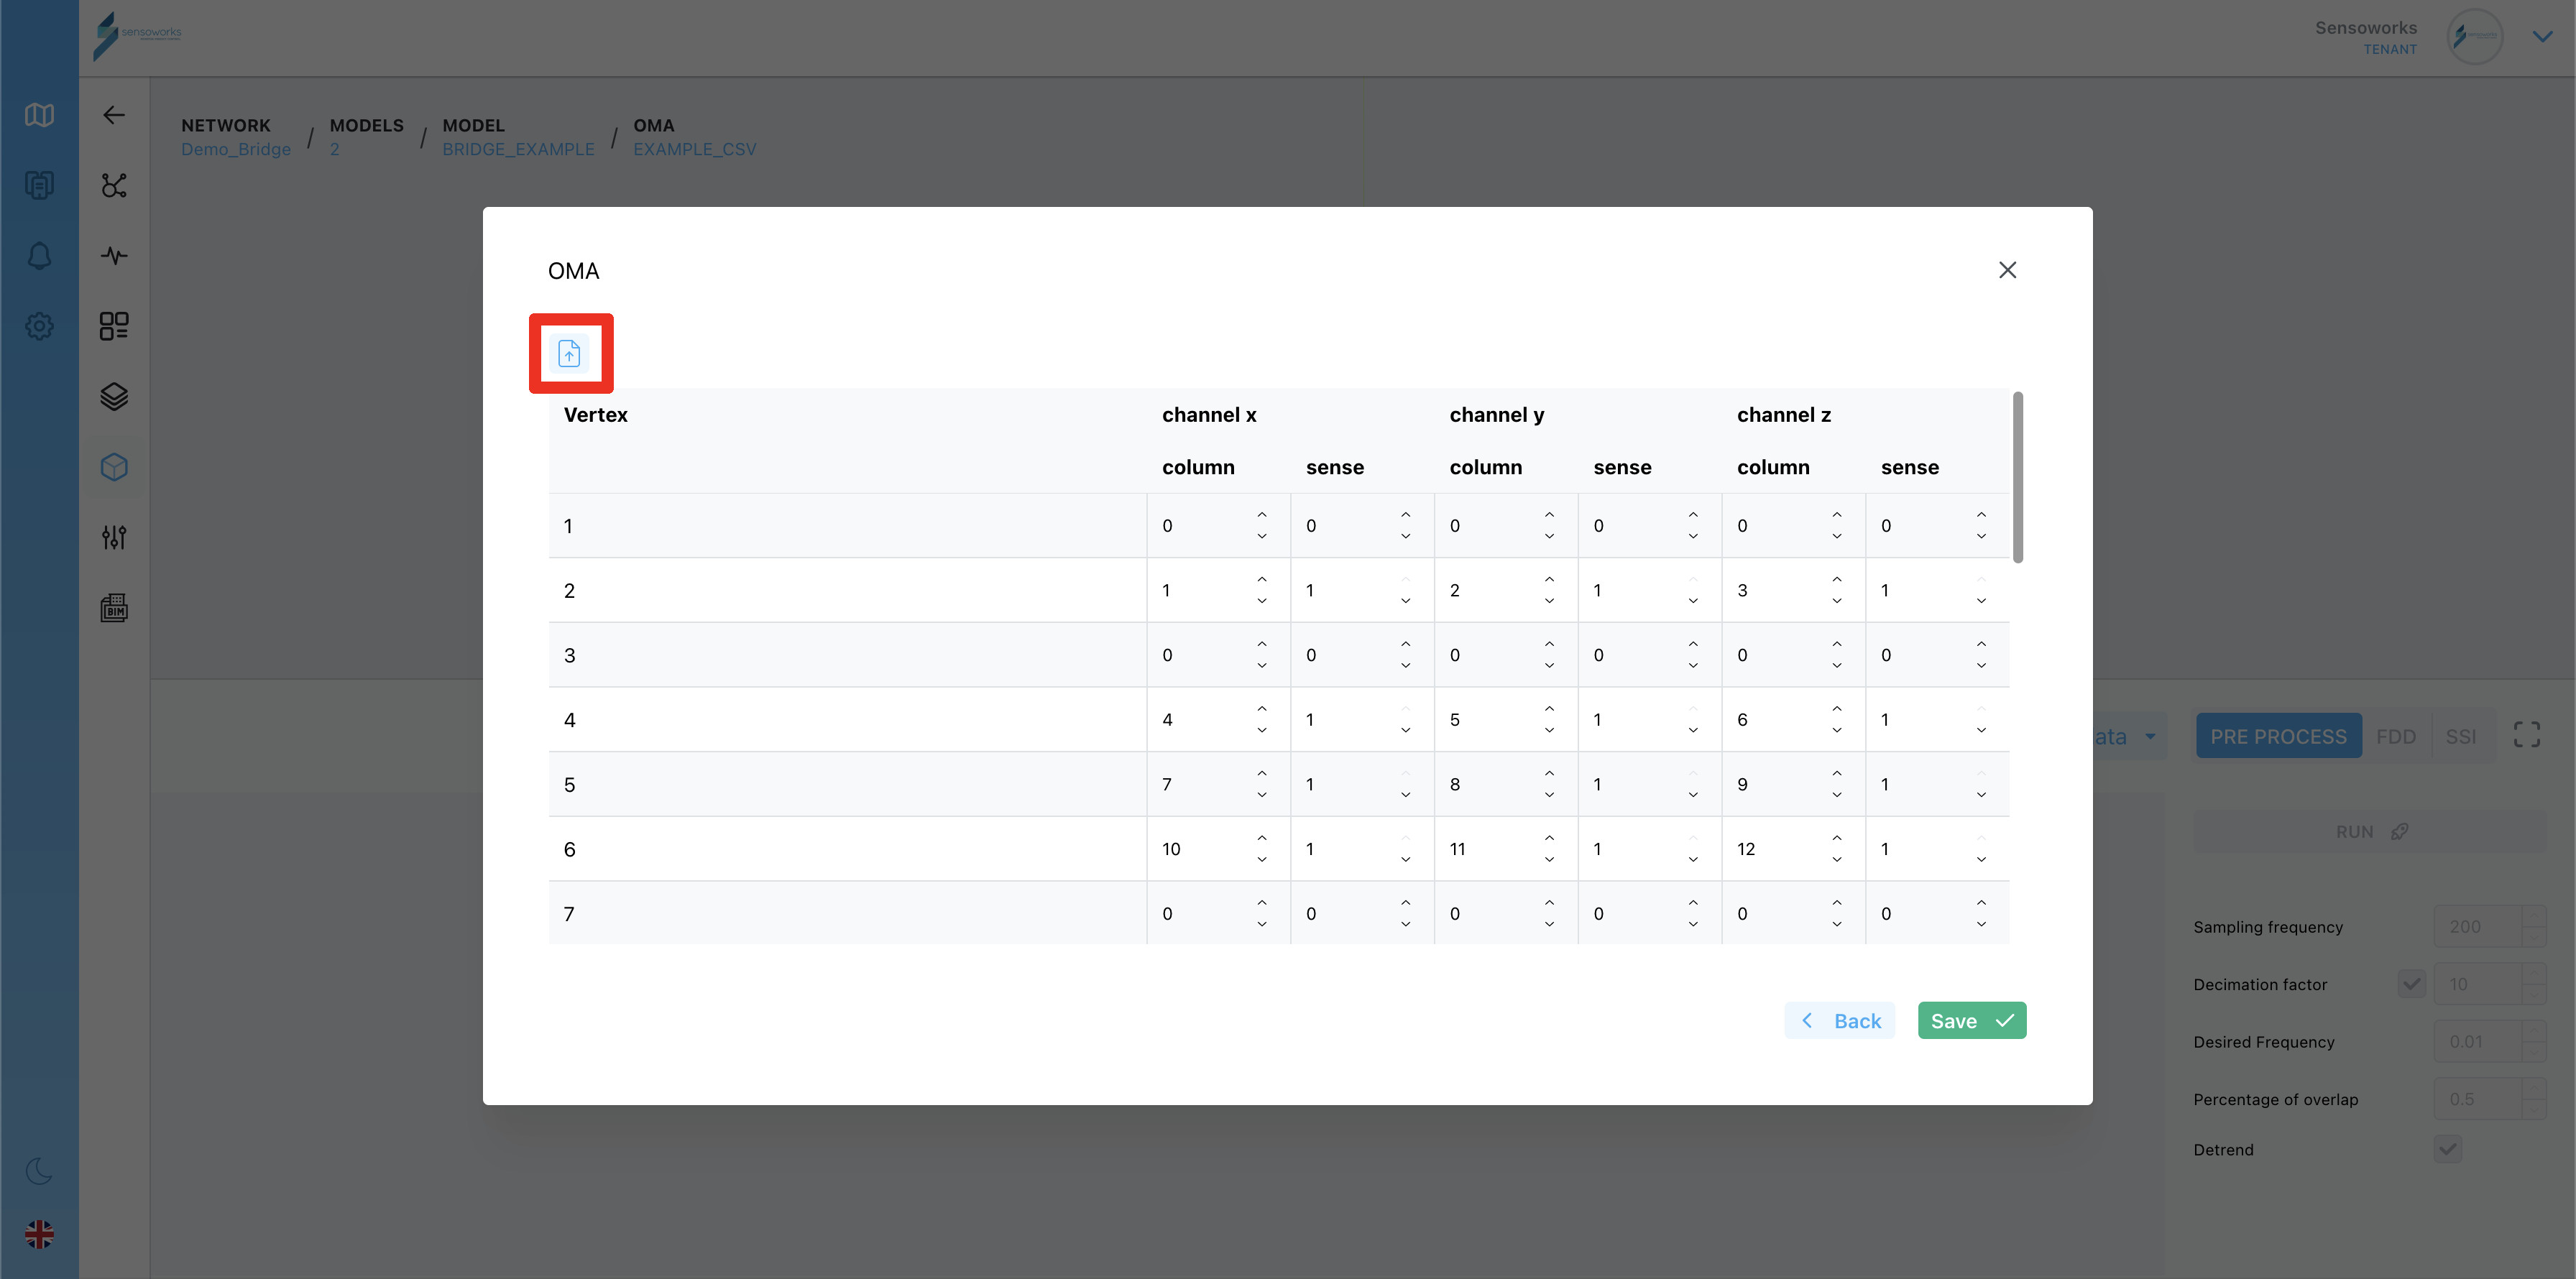
This is an example of how to prepare the CSV template.
| vertex | x | y | z | senseX | senseY | senseZ |
|---|---|---|---|---|---|---|
| 1 | 0 | 0 | 0 | 0 | 0 | 0 |
| 2 | 1 | 2 | 3 | 1 | 1 | 1 |
| 3 | 0 | 0 | 0 | 0 | 0 | 0 |
| 4 | 4 | 5 | 6 | 1 | 1 | 1 |
| 5 | 7 | 8 | 9 | 1 | 1 | 1 |
| 6 | 10 | 11 | 12 | 1 | 1 | 1 |
| 7 | 0 | 0 | 0 | 0 | 0 | 0 |
| 8 | 13 | 14 | 15 | 1 | 1 | 1 |
| 9 | 0 | 0 | 0 | 0 | 0 | 0 |
| 10 | 0 | 0 | 0 | 0 | 0 | 0 |
| vertex | Description |
|---|---|
| READY | The analysis has been created and it is ready to run |
| QUEUED | The run has been scheduled and is waiting to start |
| RUNNING | The analysis run is running |
| DONE | The run is done and the results are ready |
| ERROR | The run has ended in error |
| ABORTED | The run has been aborted by the user |
4. Running an OMA analysis
For more information about the OMA (like the parameters values), check the library used by the platform: PyOMA .
There are 3 main section in an analysis. First you need to run the preprocessing section. Only after this step you can run the FDD, the SSI or both. The following image shows the preprocessing section.
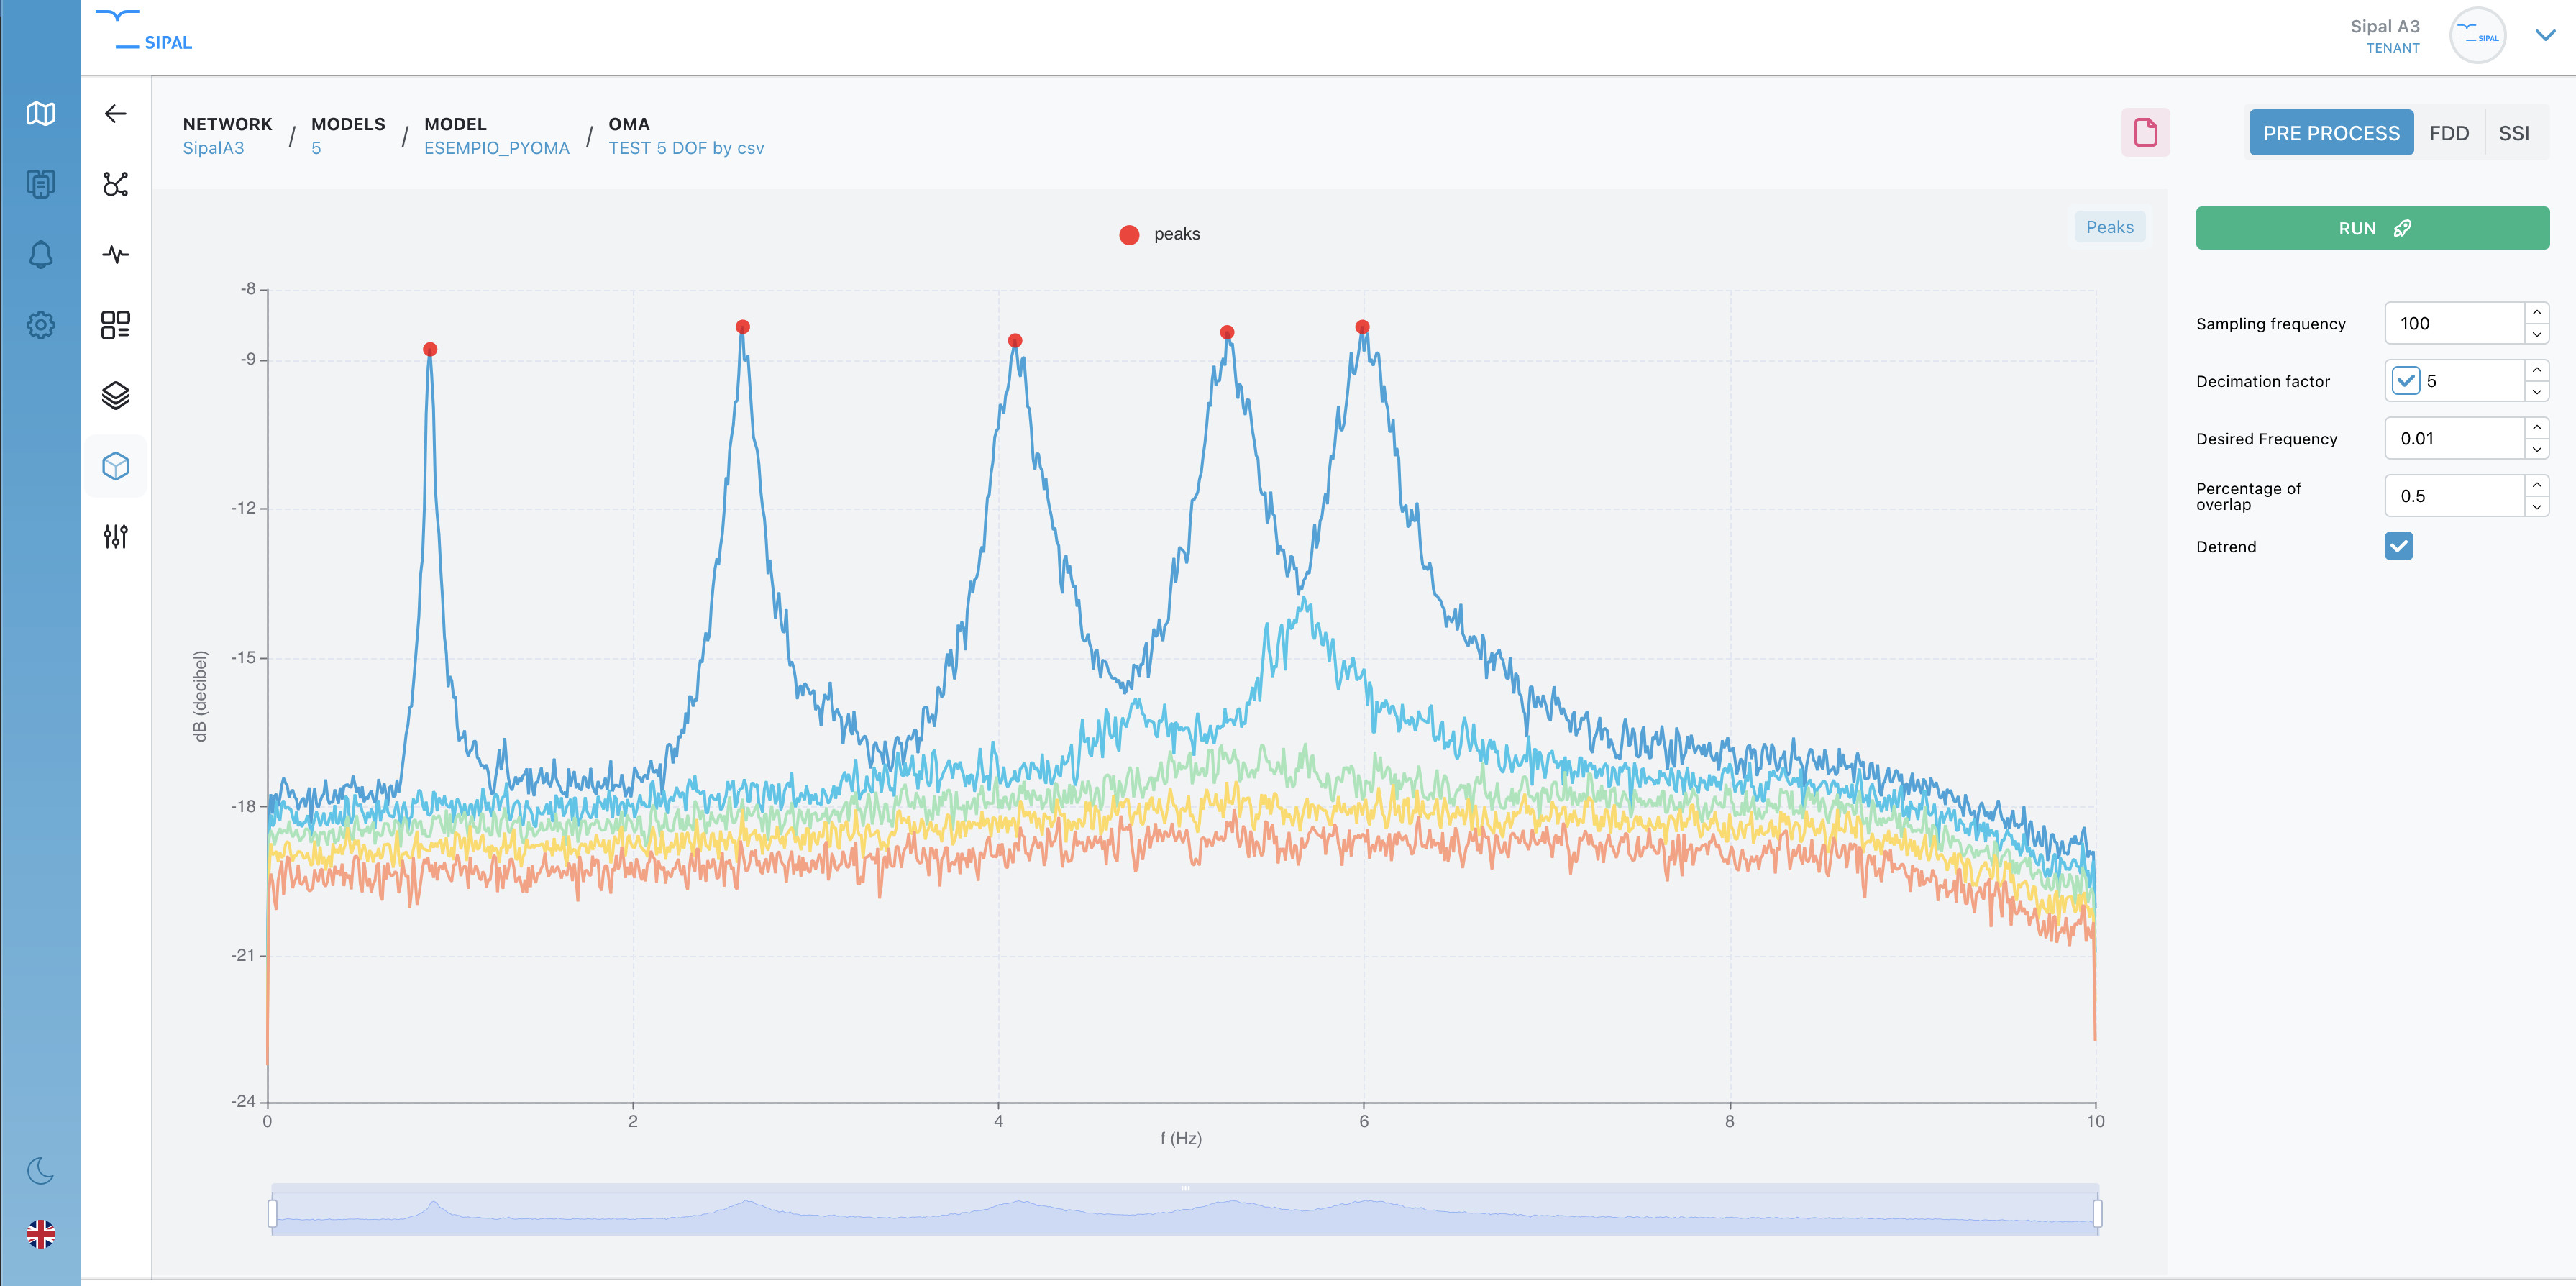
The parameters are on the right. Once the parameters are set, the run can be started. After the run has ended, the result (the chart) will be displayed.
After the preprocessing step, you can then run the FDD part of the analysis. First, choose the appropriate parameters and run the FDD. After the run has ended, the results will be shown (se image below).
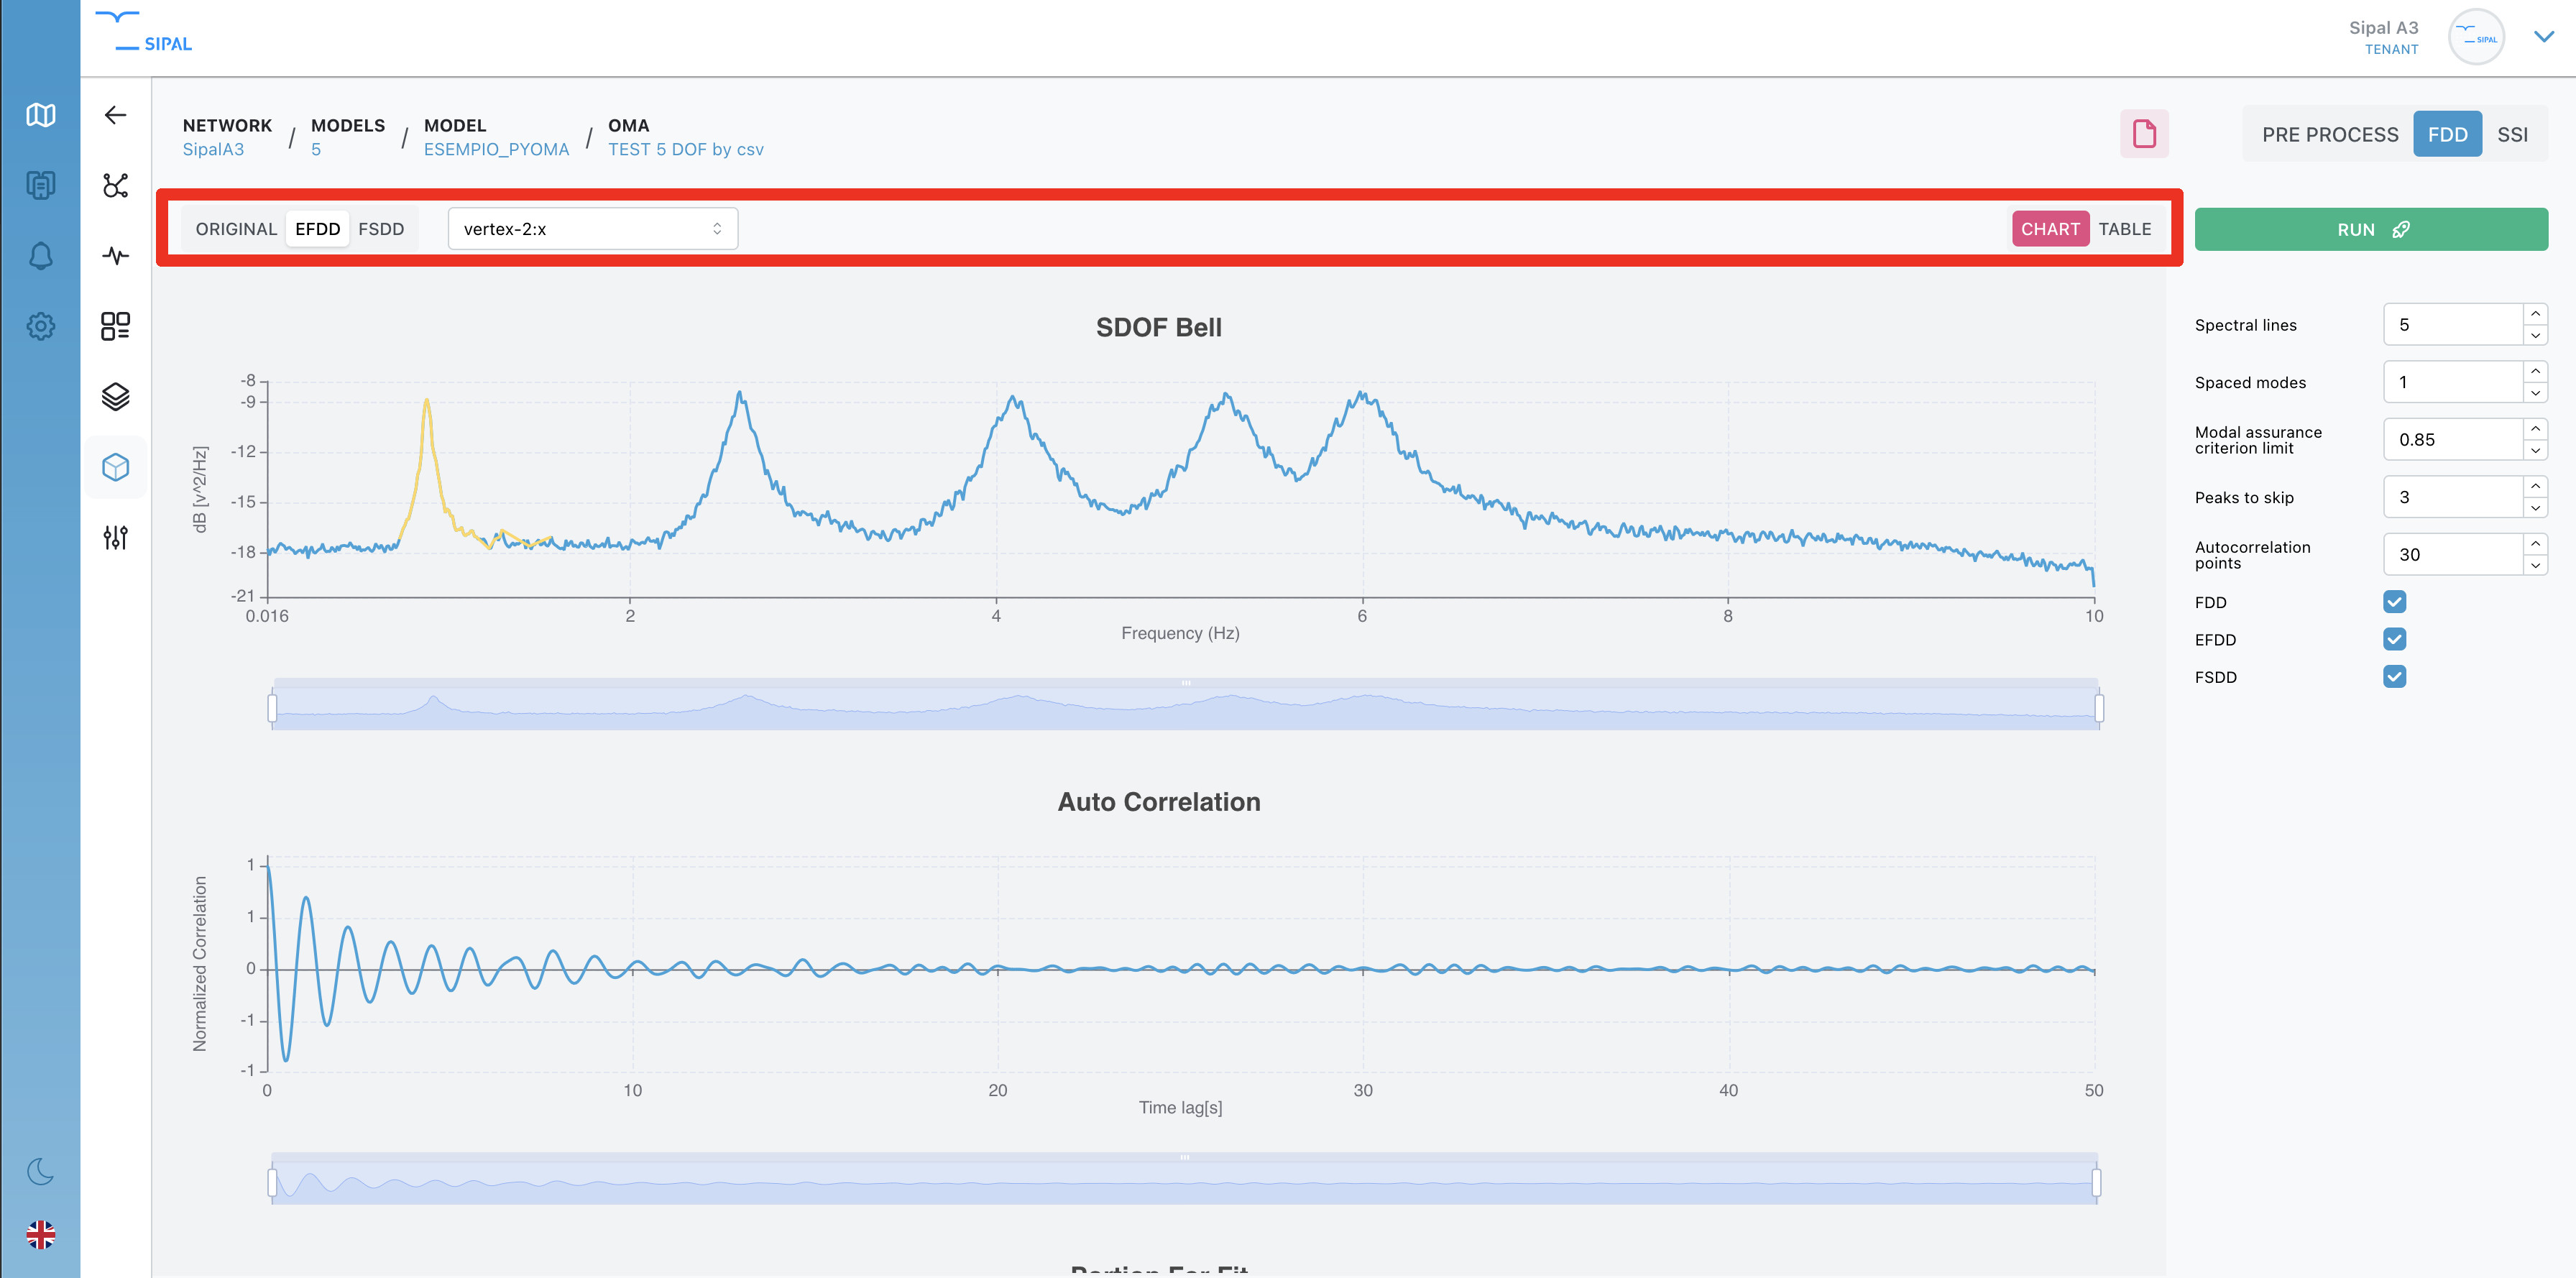
If you have selected more variants of the FDD, you can move between variants and see the charts or the tables by using the buttons highlighted in red.
After the preprocessing step, you can then run the SSI part of the analysis. First, choose the appropriate parameters and run the SSI. After the run has ended, the results will be shown (se image below).
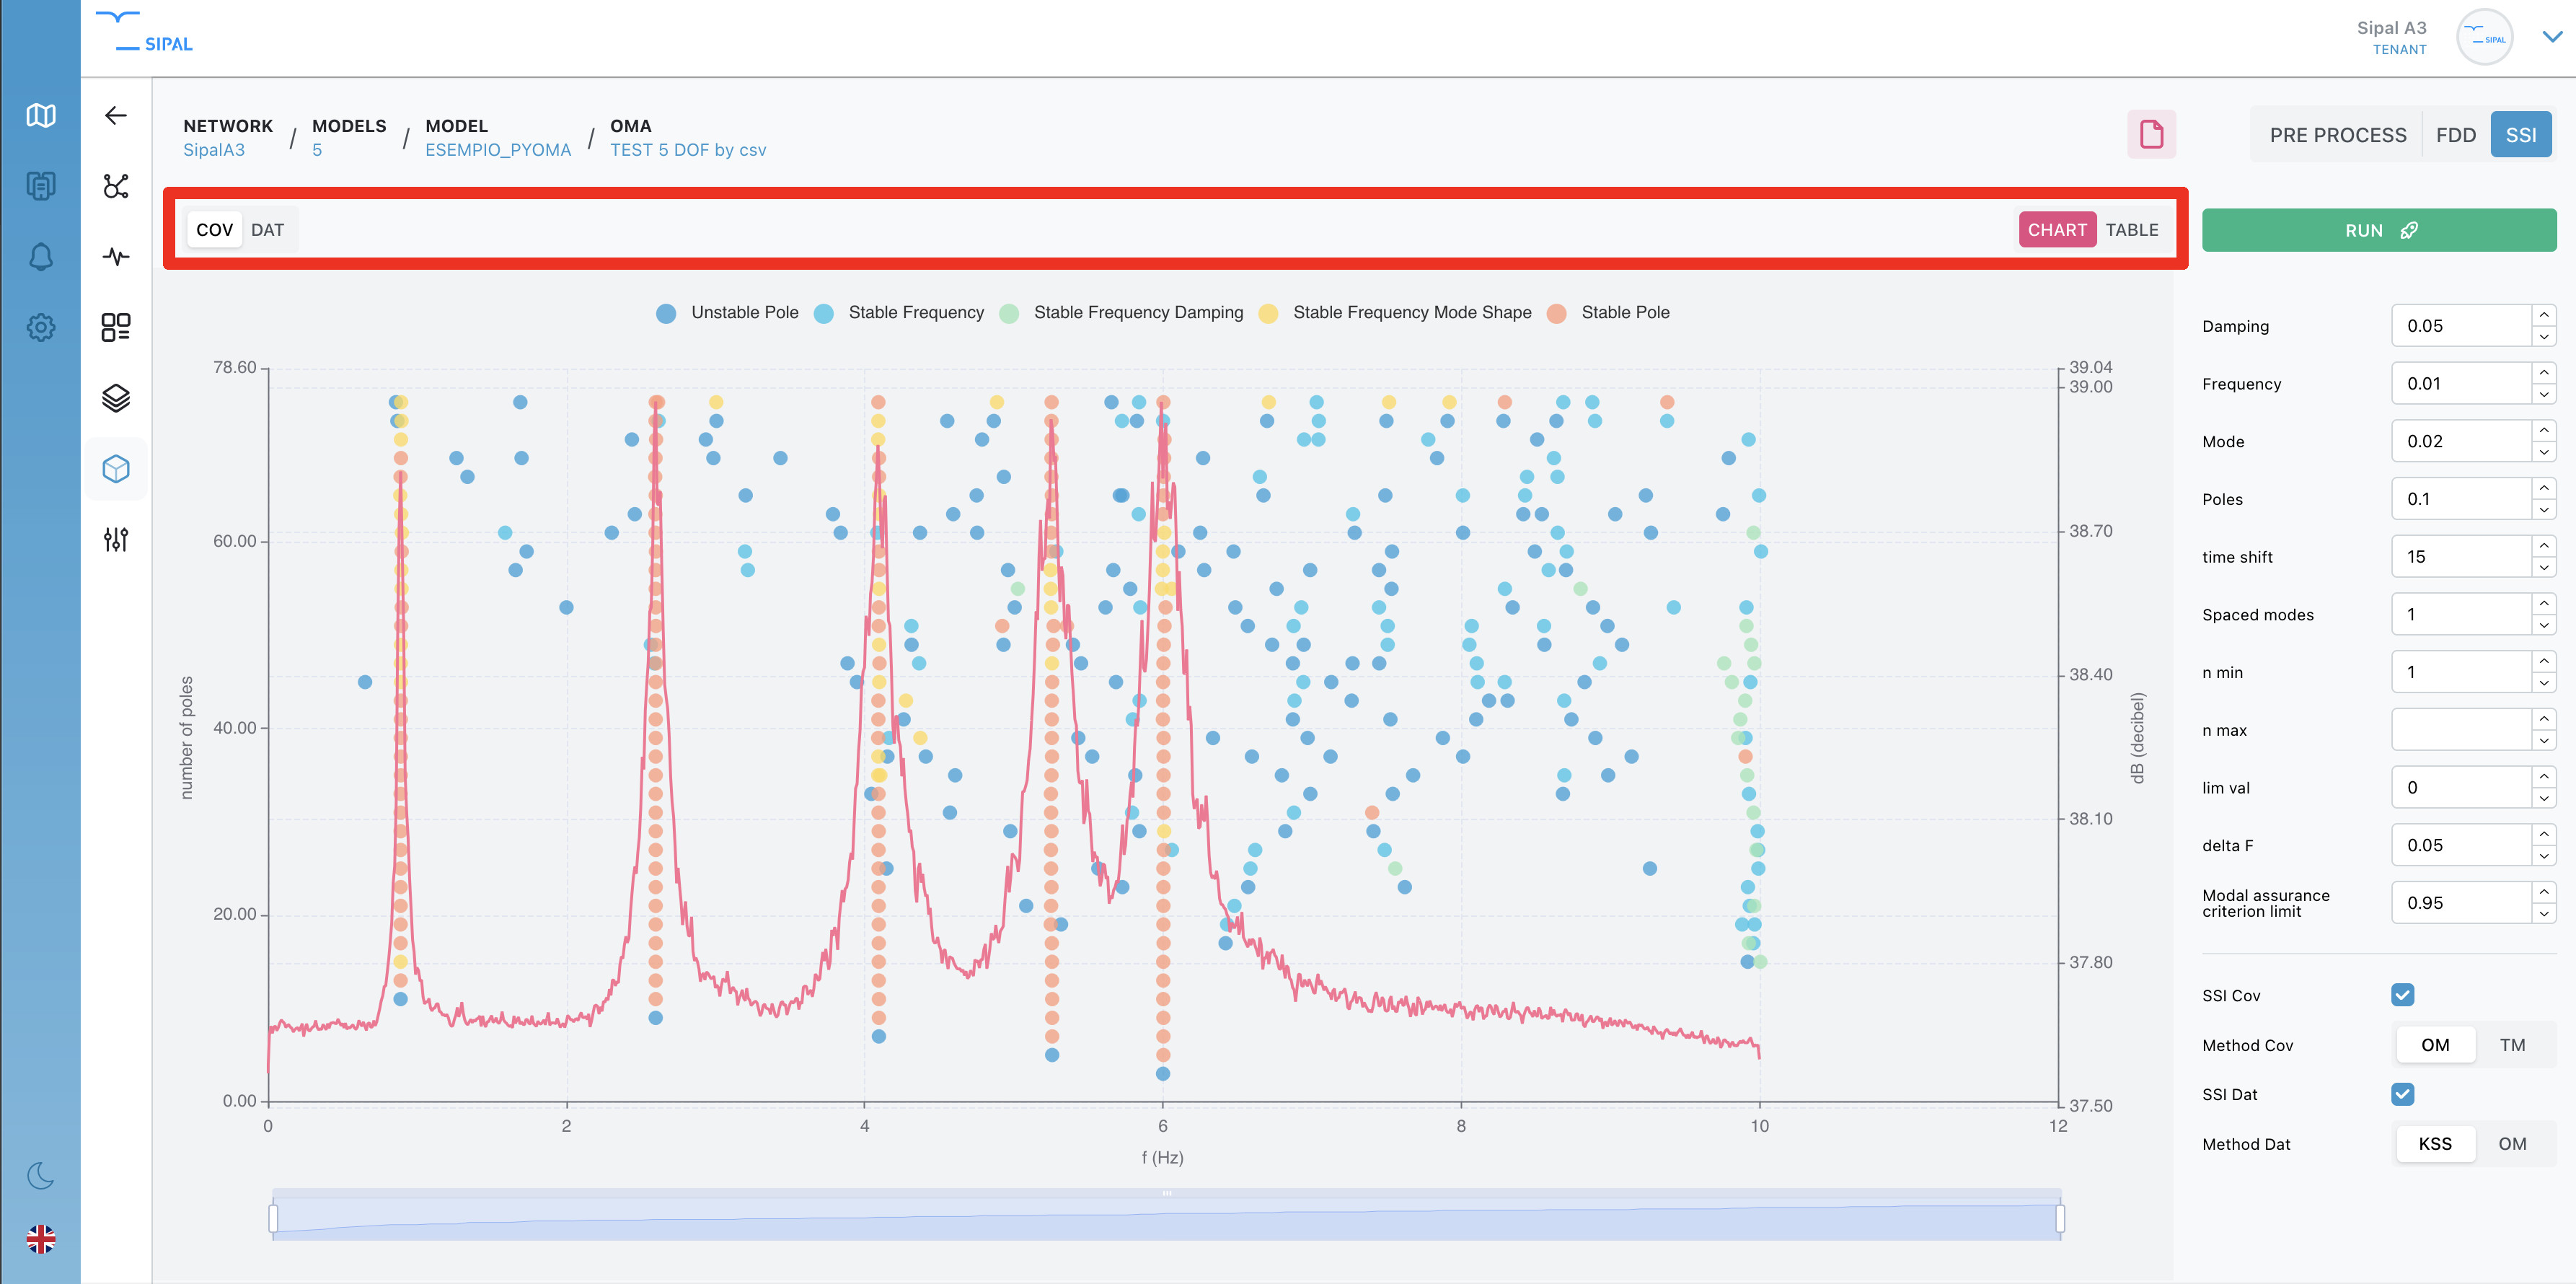
If you have selected more variants of the SSI, you can move between variants and see the charts or the tables by using the buttons highlighted in red.